Workforce Solutions
30 Seconds
Thirty seconds are all scholars have to develop an engaging commercial to showcase their talents and experience within a specific occupation. Pairs work collaboratively to keep each other on time to deliver information speedily and ask...
Curated OER
What Does Average Look Like?
Fifth graders, in groups, study the concepts of range, median, mode, and mean through the use of graphs drawn from models. They use manipulatives to represent data that they have collected within groups.
Curated OER
Statistical Specimens
Third graders are introduced to statistical vocabulary. They complete an online activity that asks them to calculate the mean, median and mode for a set of data.
Curated OER
Stem-and-Leaf Plots
Students are introduced to stem-and-leaf plots and calculating the mean, median, and mode from the plots.
Curated OER
Inequalities and Measures of Central Tendency
In this inequality and measures of central tendency worksheet, students solve and graph linear inequalities. They organize given data to identify the mean, mode and range. Students interpret box-and-whisker plots. This three-page...
Curated OER
Mean Absolute Deviation in Dot Plots
The lesson focuses on the ideas of dot plot representations and the mean absolute deviation of data sets.
Virginia Department of Education
Calculating Measures of Dispersion
Double the fun — calculate two measures of deviation. The lesson plan provides information to lead the class through the process of calculating the mean absolute deviation and the standard deviation of a data set. After learning how to...
Curated OER
Central Tendency
Fifth graders compare and contrast different sets of data on the basis of measures of central tendency.
Curated OER
An Introduction to Elementary Statistics
Students explain and appreciate the use of statistics in everyday life. They define basic terms used in statistics and compute simple measures of central tendency.
Curated OER
Holly Leaves
Sixth graders analyze mathematics by participating in a botany activity. In this holly lesson, 6th graders identify if all holly leaves have the same amount of prickles by conducting a math survey. Students analyze many leaves and...
Curated OER
Measures of Central Tendency
For this measures of central tendency worksheet, students solve and complete 6 different problems. First, they count the number of items in each set of data. Then, students determine the mean, median and mode for each. In addition, they...
Curated OER
Range and Measures of Central Tendency
Third graders take notes on a PowerPoint presentation featuring calculating and analyzing data. They practice skills highlighted in the presentation and create a table in Microsoft Excel showing data analysis.
Noyce Foundation
Through the Grapevine
Teach statistics by analyzing raisins. A thorough activity provides lesson resources for five levels to include all grades. Younger pupils work on counting and estimation, mid-level learners build on their understanding of the measures...
Curated OER
Box And Whiskers
Learners investigate the concept of using box and whisker plots. They demonstrate how to use them to compute median, mode, and range. Students compare and contrast the complete and systematic processes use to solve problems. This is done...
Curated OER
WebQuest: Thrills and Spills- Pick Your Park!
Students participate in a WebQuest in which they must determine which amusement park is the "median priced" park. Students visit park websites to accumulate prices for parking, activities, restaurants, and gift shops.
Curated OER
Global Statistics
Students determine statistics based on data. In this statistics lesson, students use data and record in charts. Students create graphs based on the statistics found.
Curated OER
Collecting, organizing and comparing data for cellular telephone buying and calculating average, and median price and best deal per cost.
Pupils research data and develop statistical methods such as mean and median price and make convincing arguments as powerful ways for decision making.
Curated OER
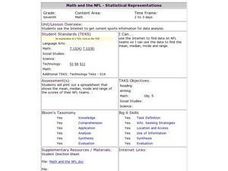
Math and the NFL - Statistical Representations
Seventh graders use the Internet to get current sports information for data analysis. They use their data to find the mean, median, mode and range. Students then place their data on a spreadsheet.
Curated OER
Stem-and-Leaf Plots
Seventh graders study steam-and-leaf plots. Given specific data, they create a stem-and-leaf plot . Students identify the mean, mode, range and median. Afterward, they review vocabulary words.
Curated OER
Describing Range and Measures of Central Tendency in Shoe Sizes
Students describe the range and various measures of central tendency using shoe sizes from a video. In this range and measures of central tendency lesson plan, students use the same data set to identify the concepts of range, mode,...
Curated OER
Stem-and-Leaf Plots
In this stem-and-leaf plots learning exercise, 8th graders solve and complete 3 different problems that include creating stem-and-leaf plots to solve problems. First, they determine the median, minimum, range and mode of the given set of...
Curated OER
Finding Range
In this range worksheet, students enter mean, median and mode for sets of number, then enter the range.
Bowland
Alien Invasion
Win the war of the worlds! Scholars solve a variety of problems related to an alien invasion. They determine where spaceships have landed on a coordinate map, devise a plan to avoid the aliens, observe the aliens, and break a code to...
NASA
Exploring Data
Bring the sun to your class! Young scholars analyze actual solar wind data in the second lesson of a five-part series. Their analysis includes speed, temperature, and density data.
Other popular searches
- Range, Mean, Median, Mode
- Range Mean Median Mode
- Mode, Range, Mean, Median
- Range, Median, Mode, Mean


