Curated OER
Data Analysis
Young statisticians use and interpret measures of center and spread such as mean, median, and mode as well as range. They use box plots to represent their data and answer questions regarding the correspondence between data sets and the...
Curated OER
Guess-timating Fun
Learners estimate the number of items in a jar and write their estimate boldly on a piece of paper. They line up holding their numbers. Then, they calculate the median, mean, mode and average of the guesses.
Curated OER
Measures of Central Tendency Using Scientific Calculators
Learners explore mean, median, and mode as they model mathematics in real-world problem situations. The instructional activity requires the use of the TI 30X IIS.
Curated OER
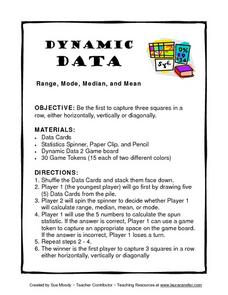
Dynamic Data Range, Mode, Median, and Mean
In this lesson, Dynamic Data Range, Mode, Median, and Mean, students play a game while figuring range, mode, median, and mean. Students spin for their task, figure the mode, mean, median or range of a row of numbers and gain a space on...
Curated OER
Data Management and Probability: Applications
In this data management and probability applications activity, 7th graders solve 13 different types of problems that include finding the mean, median, mode, and range of each set of values, as well as, solving a number of word problems....
Curated OER
Data Management and Probability: Applications
In this data management and probability applications learning exercise, 8th graders solve 20 various types of probability problems. They find the mean, median, mode and range of various numbers. Then, students use the spinner...
Shodor Education Foundation
Measures
Take a look at data from a statistical lens. An interactive allows pupils to enter data set, labeling the data including the units used. Manipulating the applet, learners select the statistics to calculate that include total, mean,...
K20 LEARN
You’re The Network: Data Analysis
How do you rate? Young scholars use graphical data to analyze ratings of different television episodes. Their analyses include best-fit lines, mean, median, mode, and range.
Pace University
Grades 7-8 Mean, Median, and Mode
Take a central look at data. The differentiated lesson provides activities for pupils to calculate central tendencies. Scholars begin choosing three central tendency activities from a Tic-Tac-Toe board. Learners then choose from sports,...
Curated OER
Applying Central Tendency
Twelfth graders calculate the mean, median, and mode of various wages. They apply these skills to asking for pay raises. They discuss whether the mean, median, or mode provide the highest wage increase.
Curated OER
Investigating Median, Mode, and Mean
Students develop strategies to organize data while following teacher demonstration. They calculate the mean, median and mode of a data set while determining the relationships between the numbers. They analyze data from tables and double...
Curated OER
Maps and Modes, Finding a Mean Home on the Range
Fifth graders investigate data from maps to solve problems. In this data lesson, 5th graders study maps and collect data from each map. Students present their data in a variety of ways and calculate the mode, mean, median, and range.
Curated OER
Making Informed Decisions Using Measures of Central Tendency
Students calculate the mean, median, mode, range, and interquartile range for a set of data. They create a box and whisker plot using paper and pencil and technology and determine which measure of central tendency is the most helpful in...
Curated OER
Data Scavenger Hunt
Eighth graders discuss how data is collected and participate in data collection through a survey. They complete a scavenger hunt on the Internet to gain understanding of the data measures mean, median, mode, and range.
Curated OER
Introduction to Measures of Central Tendency and Variability
Young scholars calculate the mean, median, mode, range, and interquartile range for a set of data. They create a box and whisker plot using paper, pencil and technology.
Curated OER
Tackling Mean - Median and Mode
Second graders wear a favorite sports jersey to school. They calculate the mean, median and mode of the numbers represented on the jerseys. They present and explain their calculations to the class.
Curated OER
The Statistics of Shoes
Students open a blank spreadsheet and format it for a class survey about the number of shoes owned by the men and women in the class. They enter the data before finding the mean, median, mode, quartiles, variance, and the standard...
Curated OER
Candy Colors: Figuring the Mean, Median, and Mode
Students count candy by color and then calculate mean, median, and mode. They count candy and use the data to calculate mean, median, and mode (by color) and apply their learning to another collection of data.
Curated OER
Mean, Median, and Mode
Fifth graders compute the mean, median, and mode of sets of numbers.
Curated OER
Energy Audit
Learners collect data about energy usage and use mathematical calculations to analyze their data. In this energy conservation and statistics math instructional activity, students survey their homes to complete an energy usage worksheet....
Curated OER
Using Graphical Displays to Depict Health Trends in America's Youth
Identify the different types of graphs and when they are used. Learners will research a specific health issue facing teens today. They then develop a survey, collect and analyze data and present their findings in class. This is a lesson...
Curated OER
Mean, median, and mode... Use the data
Ninth graders participate in a instructional activity focused on the concept of basic statistics. They find the mean, median, and mode of different data sets. More advanced students could practice creating a bell curve from the data.
Curated OER
Shedding Light on the Weather with Relative Humidity
Learners study weather using a graphing calculator in this lesson plan. They collect data for temperature and relative humidity for every hour over a day from the newspaper, then place the data in their handheld calculator and examine it...
Shodor Education Foundation
Plop It!
Build upon and stack up data to get the complete picture. Using the applet, pupils build bar graphs. As the bar graph builds, the interactive graphically displays the mean, median, and mode. Learners finish by exploring the changes in...


