Curated OER
Introduction to Graphical Representation of Data Sets in Connection with Nuclear Decay
Students record data, make observations, and share in experimentation and discussion of numerical experiments.
Curated OER
Penguin Heights
Students use the worksheet from the first website listed below to collect data on the penguin heights on the Penguin Page.
Curated OER
Opening the Case
Students participate in a class survey and then design an experiment and use graphs and statistics to assist them in solving a problem. They organize the results of the survey in a stem-and-leaf plot and find the range, median, mean, and...
Curated OER
What's the Attraction?
Students experiment with magnets to determine the distances at which they attract and repel each other.
Curated OER
DESIGN AND BUILD A MAGNETOMETER
Pupils brainstorm and design an instrument to detect magnetic field direction. The design approximates the design included in this activity. They build a functioning magnetometer, a device for detecting the relative direction of the...
Curated OER
Analytical Spectroscope
Students using a spectroscope view different substances when heated with electricity.
Curated OER
Fire Fighting Crew
Students use the concepts in statistics to make decisions. They calculate the mean, median and mode. They compare one firefighter against another and analyze the data. They share their information with the class.
Curated OER
It Takes All Kinds!
Students view video clips and observe similarities and differences between animals. They sort animals into groups for a zoo. They make a graph of their observations and review scientific classifications.
Curated OER
Pageantry of the Senate
Tenth graders gain a better understanding of the historical significance of some of the procedures and traditions of the Senate. They see that the Senate in Canada is rich in traditions and pageantry.
Curated OER
The Effects of Environment on Plant Growth: Selecting Seeds for Survival on a New Planet
Fifth graders conduct experiments to compare seed germination and plant growth rates. They construct a hydroponic plant unit and a lighthouse. They care for the plants for a month and collect data for graphs. They write a report.
Curated OER
What is a Cloud
Third graders study clouds and how they are formed. They write acrostic poems about clouds and analyze and graph temperature data collected during varying degrees of cloud cover.
Curated OER
Graphing Inertia: An Oxymoron?
Eighth graders investigate Newton's Law of Inertia in order to create a context for the review of the use of different types of graphs. They practice gathering the data from an experiment and put it into the correct corresponding graph.
Curated OER
Unscramble the Letters - Music Terms
Students receive a worksheet on music terms. As a class, they unscramble a couple before attempt them on their own. They then write the meaning of each to research the meaning of the musical terms.
Curated OER
Meadows Observations
Learners investigate and examine the different living things they find in a meadow. Students record the different colors that are present and create a graph, identify and label parts of a plant, use a magnifying lens to examine all ...
Curated OER
May We Present Planet Earth?
Students draw a map to scale. They illustrate knowledge of how to use DOGS TAILS on a map. Students identify the main parts of a map. They identify and illustrate the major features necessary for sustaining a quality of life for a society.
Curated OER
Exploring Scale
Sixth graders discuss how the scale and type of graph can change how the data appears. With a partner, they identify all the information about the graph in a specific amount of time and record them in a journal. To end the lesson, they...
Curated OER
Numeracy Practice- Going Out For Lunch
In this math worksheet, students complete the various types of activities that include graphs, data tables, and completing number sentences.
Curated OER
SolidWorks for Sheet metal
Pupils practice using the different tools on the Sheet Metal toolbar. In this engineering instructional activity, students create a sketch given a set of procedures to follow.
Khan Academy
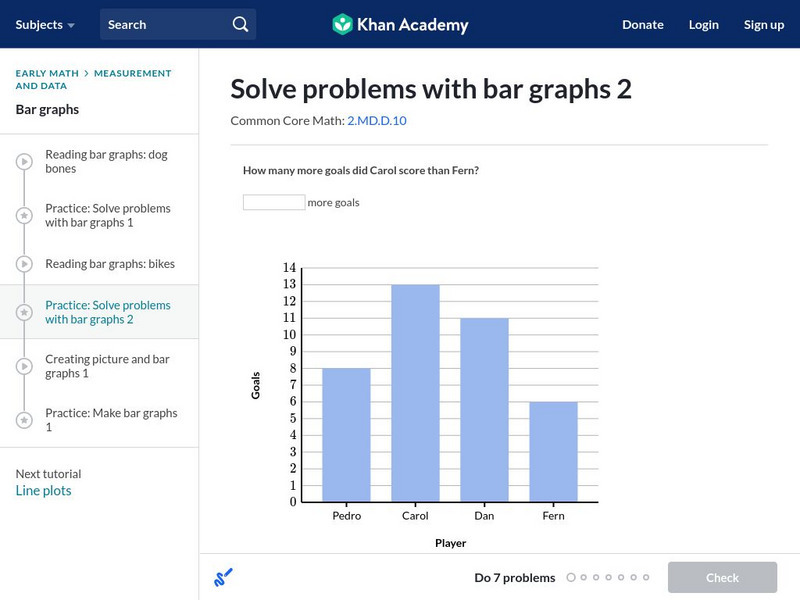
Khan Academy: Solve Problems With Bar Graphs 2
Use bar graphs to solve addition and subtraction word problems. Students receive immediate feedback and have the opportunity to try questions repeatedly, watch a tutorial video, or receive hints.
Khan Academy
Khan Academy: Solving Problems With Bar Graphs 2
In this exercise, students practice solving problems with bar graphs. Students receive immediate feedback and have the opportunity to get hints, watch a tutorial video, and try questions repeatedly.
National Council of Teachers of Mathematics
The Math Forum: Intro to Measurement for Primary Students
This site from the Math Forum is a great introduction to measurement for primary students. Each measurement activity has four components: interactive, manipulative-based project; technology; paper/pencil practice; literature connection.
Music Theory
Music thoery.net: Measures and Time Signatures
A fabulous resource for beginners! Gives examples and explanations of measures and time signatures. Simple illustrations and explanations make this animated site easy to follow.
Khan Academy
Khan Academy: Make Bar Graphs 1
Practice creating bar graphs (bar charts) from data sets. Students receive immediate feedback and have the opportunity to try questions repeatedly, watch a video or receive hints.
Khan Academy
Khan Academy: Make Bar Graphs 1
A practice quiz where students construct bar graphs using the given information. Includes hints.


