Khan Academy
Khan Academy: Measure the Earth's Field!
You can use a bar magnet and a compass to get a rough idea of the strength of Earth's magnetic field. Read this article to find out how!
Khan Academy
Khan Academy: Solve Problems With Bar Graphs 1
Read and interpret bar graphs. Students receive immediate feedback and have the opportunity to try questions repeatedly, watch a video or receive hints.
National Council of Teachers of Mathematics
The Math Forum: Lesson Plan Non Standard Measuring
This is a short, fun lesson plan with a literature connection, "Miss Nelson is Missing". It uses candy bars as non-standard units for measuring objects in the classroom.
National Council of Teachers of Mathematics
The Math Forum: Lesson Plan Non Standard Measuring
This is a short, fun lesson plan with a literature connection, "Miss Nelson is Missing". It uses candy bars as non-standard units for measuring objects in the classroom.
Science Education Resource Center at Carleton College
Serc: Measuring Discharge and Flow in the Rum River
Young scholars will travel to a small stream and make predictions regarding stream discharge at the point bar and cut bank. They will make conclusions about how velocity affects erosion and discharge.
TeachEngineering
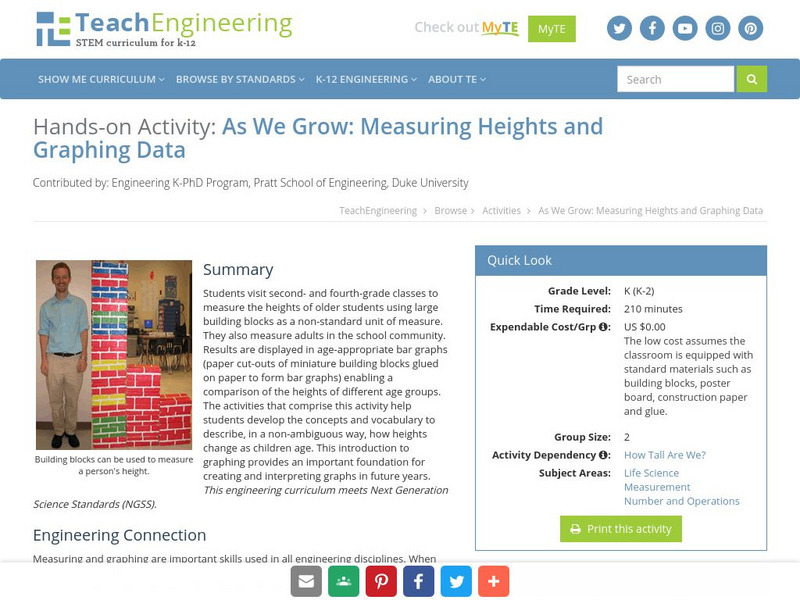
Teach Engineering: Growing and Graphing
Students visit a 2nd and a 4th grade class to measure the heights of older students using large building blocks as a non-standard unit of measure. They can also measure adults in the school community. Results are displayed in...
Utah Education Network
Uen: Candy Bar Density
Activity allows students to think about what makes one object more or less dense than another.
Other
Basic Music Theory: Bar or Measure
This website is extremely valuable in that it describes topics in easy-to-understand language. Relatively easy to follow. Just use the hypertext links.
TeachEngineering
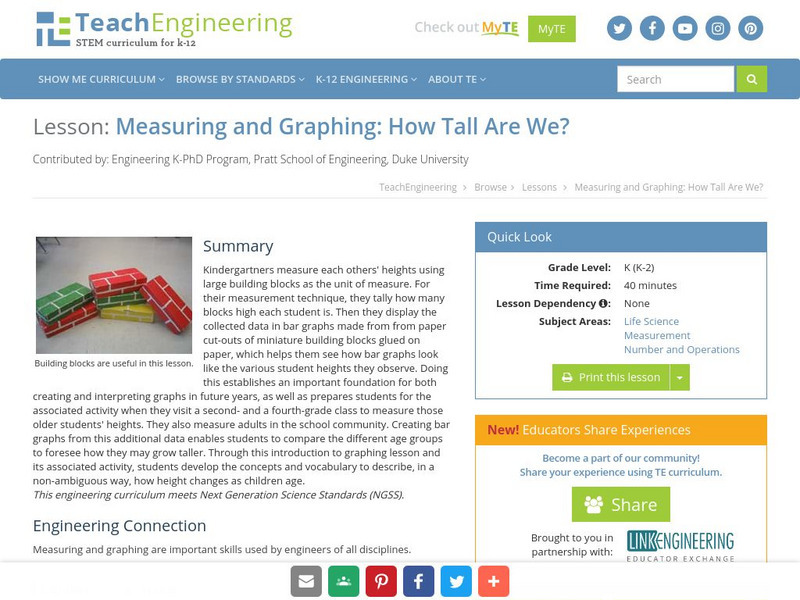
Teach Engineering: How Tall Are We?
Kindergartners measure each other's height using large building blocks, then visit a 2nd and a 4th grade class to measure those students. They can also measure adults in the school community. Results are displayed in age-appropriate bar...
PBS
Pbs Mathline: Sand Babies (Pdf) [Pdf]
In this engaging lesson, students use a variety of measurement strategies in creating their own Sand Babies. Students explore standard and non-standard measurements, area, data collection and analysis, and graphing. Adaptations are...
Science Buddies
Science Buddies: Interpreting Area Data From Maps vs. Graphs
Graphical methods of data presentation are a key feature of scientific communication. This project asks the question, "What's the best way to compare the land area of states: a map or a bar graph?" You'll be measuring performance on two...
Science and Mathematics Initiative for Learning Enhancement (SMILE)
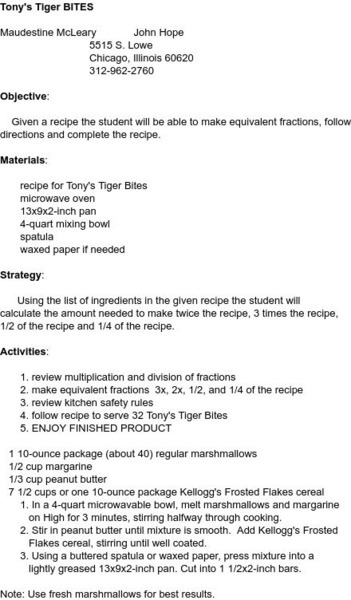
Smile: Lesson Plan: Tony's Tiger Bites
In this instructional activity, students are given a marshmallow cereal bar recipe and are challenged to make equivalent fractions while following directions.
TeachEngineering
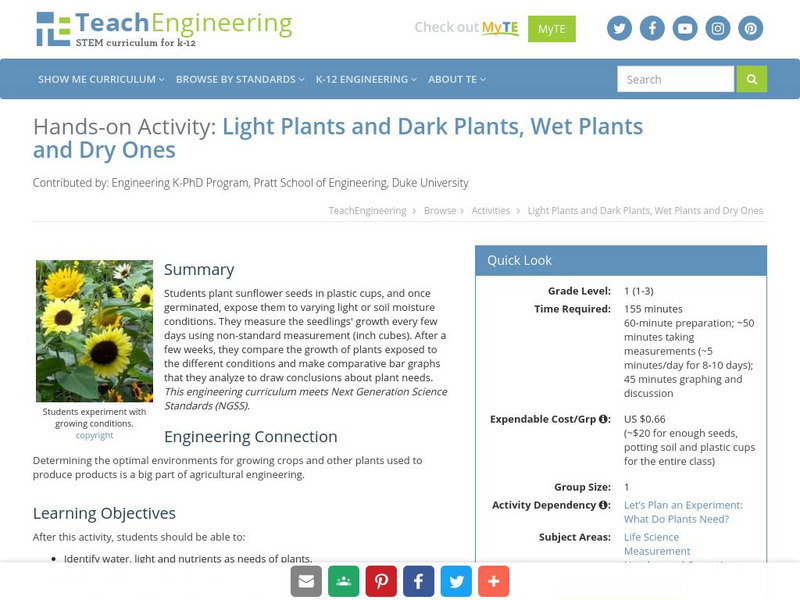
Teach Engineering: Light Plants and Dark Plants, Wet Plants and Dry Ones
Students plant sunflower seeds in plastic cups, and once germinated, these are exposed to different conditions of light levels and/or soil moisture contents. During exposure of the plants to these different conditions, students measure...
ClassFlow
Class Flow: Egg Graphing
[Free Registration/Login Required] This flipchart is a measurement activity to prepare for MAP test it incorporates bar graphing.
Beacon Learning Center
Beacon Learning Center: All That Data 2
Students describe graphs and explore range, measures of central tendency, and distribution in this interactive web lesson.
International Olympic Committee
International Olympic Committee: Gymnastics
This presentation shows the types of gymnastic events performed by both men and women in Summer Olympics, gives measurements of the various apparatuses used, and provides a brief explanation of how medalists are chosen.
Beacon Learning Center
Beacon Learning Center: All That Data
Students analyze data by finding the mean, median, mode, and range of a set of numbers. Line plots, bar graphs, and circle graphs are also included in this lesson.
Exploratorium
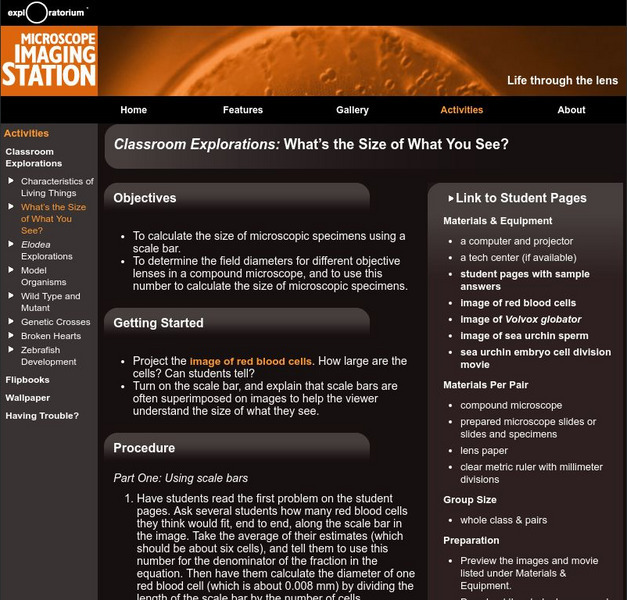
Exploratorium: Microscope Imaging Station: What's the Size of What You See?
In this lesson, you use microscope images to show how to use scale bars to measure very small things.
Concord Consortium
Seeing Math: Plop It
Plop It! lets you experiment with the concepts of mean, median, and mode (measures of center). You see the differences among them on a bar graph, as you add or remove blocks to an axis with a given range.
Khan Academy
Khan Academy: Make Line Plots
Practice creating line plots (dot plots) from data sets. Students receive immediate feedback and have the opportunity to try questions repeatedly, watch a tutorial video, or receive hints.
Council for Economic Education
Econ Ed Link: It Ain't Where You Start, It's What You Got, and Where You End
This year's federal elections will involve electing a president, all members of the House of Representatives, and one-third of the Senate. Barring some international crisis, economic issues appear likely to dominate the debates. In past...
E-learning for Kids
E Learning for Kids: Math: Dinosaurs: Data and Chance
Students can play learning games to explore how to label, read, and create graphs using a dinosaur theme.
Curated OER
Image Processing Tool Bar
This site provides a tutorial on using computer image processing techniques to measure the size of sunspots and analyzing various phenomena visible in solar images. It also provides lesson plans for teachers to use in class.
TED Talks
Ted: Ted Ed: The History of the Barometer (And How It Works)
A barometer is an instrument that measures air pressure, allowing weather forecasters and scientists to better predict extreme weather events. Despite its incredible usefulness, inventing the barometer was no walk in the park. Asaf...


