CPO Science
Science Worksheets
If you need an array of worksheets to augment your science lessons, peruse a collection of assignments that is sure to fit your needs. With topics such as metric conversion, the scientific method, textbook features, research skills,...
Curated OER
Choosing the Best Graph
In this mathematics worksheet, 6th graders use a line graph to illustrate how a measure of data changes and explain their reasoning. Then they use a bar graph to compare pieces of data and a pictograph to compare data.
Curated OER
Angles on a Line and on a Point
In this angles worksheet, students solve 24 problems pertaining to angle measurements on a line and on a point. There are also calculations of adjacent angles and supplementary angles. The page is intended as an online activity but can...
Curated OER
Dealing With Money and Measurement- Addition and Subtraction of Decimals
In this dealing with money and measurement worksheet, students practice adding and subtracting with decimals. They complete 12 short word problems and check their answers online.
Curated OER
Misleading Statistics
In this misleading statistics activity, students identify misleading graphs. They determine the mean, median and mode of given data. Students determine the measure of central tendency which accurately describes the data. This one-page...
Curated OER
Measurements with Noncount Nouns
In this non count nouns worksheet, students name the items in the picture and use a unit of measure from the box. Students complete 14 examples.
EngageNY
Interpreting Division of a Whole Number by a Fraction—Visual Models
Connect division with multiplication through the use of models. Groups solve problems involving the division of a whole number by a fraction using models. The groups share their methods along with the corresponding division and...
Curated OER
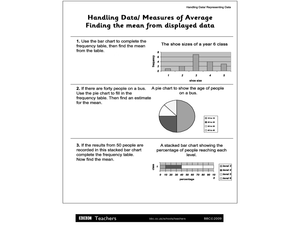
Handling Data/Measures of Average - Finding the Mean from Displayed Data
In this mean and average worksheet, learners use the bars and charts to help them find the means using the given data. Students solve 3 problems.
DK Publishing
Real-life Word Problems, Part 4
Bring math to real life with this review resource! With five word problems on bars of chocolate, boxes of tissues, and bottles of lemonade, this is an excellent way for fourth graders to apply their math knowledge to real life scenarios....
It's About Time
Center of Mass
Lead your class on an exploration as they locate the center of mass in several oddly shaped two-dimensional objects they create from their imaginations. Pupils also determine the location of the center of mass in three-dimensional...
Curated OER
Impact Craters Activity
Lunar explorers perform an experiment to understand the size of the craters on the surface of the moon. They layer flour, laundry detergent, and cocoa powder in a pan to model the lunar surface. They drop marbles from different heights...
Curated OER
MAP Practice
In this geometry worksheet, students create circle, line and bar graphs using different comparisons of events. There are 24 questions with an answer key.
Fun Music Company
Note Values
Note values are the focus of a short worksheet that asks young musicians to respond to short-answer questions and to complete a measure with notes of the appropriate value.
Curated OER
E3 Practice Assessment - Pets
In this assessment learning exercise, 3rd graders complete eight pages of math assessment. Students solve problems related to money and a bar graph. Students solve word problems involving rounding and computation.
Curated OER
Understanding Statistics
In this statistics worksheet, students examine and interpret pictographs and line graphs. Students analyze the provided data in order to create bar graphs, circle graphs, and box and whisker plots. The nine page worksheet accompanies a...
Curated OER
Quiz 3A: Measurements With Noncount Nouns
In this nouns worksheet, students name the item in each picture using a unit of measure from the word bank. There are 15 items to name on this worksheet.
Curated OER
Nine Examples for Tables, Pictographs, Mean. Median, and Mode
In this graphical representation of data and measures of central tendency worksheet, students calculate mean, median, and mode and answer questions related to graphs, tables, and pictographs.
Curated OER
Mean, Median, and Mode 1
In this mean, median and mode worksheet, students use the measures of central tendency to describe given statistical data. Students identify the range of data, and match data to its representative bar graph. Two multi-step problems are...
Curated OER
5th Grade Science
In this science worksheet, 5th graders complete multiple choice questions about flight, astronomers, measurement, temperature, and more. Students complete 25 questions.
EngageNY
Interpreting and Computing Division of a Fraction by a Fraction—More Models
Use a unit approach in developing a fraction division strategy. The teacher leads a discussion on division containing units, resulting in a connection between the units and like denominators. Pupils develop a rule in dividing fractions...
Balanced Assessment
Stock Market
Analyze trends in the stock market using histograms. Future economists use data presented in a histogram to find periods of greatest increase and decrease. They also draw conclusions about days that would be best to invest.
EngageNY
Creating Division Stories
Create your own adventure story ... well, not really. The fifth lesson in a 21-part series has pairs create story contexts for division problems. The lesson presents a step-by-step process for pupils to follow in writing such stories.
EngageNY
More Division Stories
Don't part with a resource on partitive division. Continuing along the lines of the previous activity, pupils create stories for division problems, this time for partitive division problems. Trying out different situations and units...
Music Fun
Practice Boards
FACE it. Every Good Boy Deserves Fruit! (And so do girls.) Provide young musicians with music worksheets that enable them to practice musical notation. The six boards included in the packet are templates that focus on notes, rests,...


