Houghton Mifflin Harcourt
Use a Graph: Measure Fish
Something's fishy here! Use the bar graph provided to determine the length of each fish shown. Small cartoon fish make this an engaging learning exercise for young learners. There are six questions provided.
Curated OER
Using Your Marbles - Volume Measurement and Reporting
Demonstrate how to measure the volume of liquids and solids immersed in liquid to your class. They observe a teacher-led demonstration, and in small groups construct a data table that demonstrates how many marbles were used and the...
Captain Planet Foundation
Shape Shifters in the Math Garden
Combines mathematical measurement with gardening skills. Third graders hunt for worms in the garden and try to find the longest one. They also measure and weigh vegetables that they harvest from the garden, measure rainfall amounts, and...
Curated OER
Olympic Bar Graphs
In this Olympic bar graph worksheet, young scholars pick a sport from the 2004 Olympic games and find data from the Olympic web page. They graph the scores (times, distance, or speed) and the medals. They answer questions about the...
Curated OER
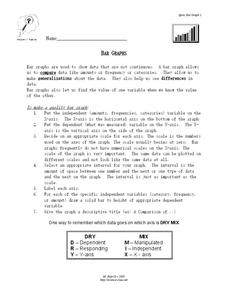
Bar Graphs
In this bar graph worksheet, students read about making quality bar graphs and they make a bar graph using given data. They answer 5 questions about their graph.
PHET
Measuring the Interplanetary Magnetic Field
Scientists need to figure out how to measure interplanetary magnetic fields, but the magnetic field of the spacecraft is interfering with their readings. Scholars attempt to solve the problem that has perplexed NASA scientists for years.
Curated OER
Are You Full of Hot Air?
Explore the concept of measuring and recording circumference. In this physical science and measurement lesson, young learners blow up balloons, measure the circumference, and record the data on an interactive graphing website.
Curated OER
Physical Science: Festival of Bubbles
Investigate bubbles through the use of scientific inquiry. Pupils blow bubbles using several methods and measure the resulting bubble print. Measurements are recorded on a data table and transferred to a bar graph. Results are discussed...
Curated OER
Red Worms Rock!
Second graders measure red worms. In this lesson plan, 2nd graders observe and collect data on red worms. Students measure the red worms and create a graph with the data they collect.
Curated OER
Survey of Height
In this data collection worksheet, learners survey the heights of their fellow classmates, organize their data in a data table, and create a bar graph from their data. Once bar graph is completed, students complete 2 short answer...
Curated OER
Parachute Drop
Learners will have fun creating a parachute to collect data with. They will construct the parachute in small groups, measure the materials, and create an observation sheet. Then they drop the parachute and make predictions about how long...
Baylor College
Living Things and Their Needs: The Math Link
Enrich your study of living things with these cross-curricular math activities. Following along with the story Tillena Lou's Day in the Sun, learners will practice addition and subtraction, learn how to measure volume and length, work on...
Curated OER
Can You Measure Up!
Seventh graders investigate standards of measurement and metric units using a game to show the importance of standards of measurements. In this measuring lesson plan, 7th graders are grouped together and each group represents a foreign...
Curated OER
Organizing Data
In this data worksheet, learners convert measurements to significant notation and determine the number of significant digits. This worksheet has 4 fill in the blank and 2 short answer questions.
Teach Engineering
Bend That Bar
Bend it, but don't break it. Groups investigate the strength of different materials. Using a procedure in the seventh segment of a 22-part series on aviation, pupils determine how far a rod will bend. They determine the strength-to-mass...
Curated OER
A Plop and Fizz
Seventh graders perform an experiment to determine the effect of temperature on reaction rates. In this chemistry instructional activity, 7th graders take measurements and record data. They create a graph and analyze results.
Curated OER
Bellwork for Week 2-Experimental Design and Measurements
In this experimental design and measurement worksheet, students answer questions about independent and dependent variables, they write hypotheses, they identify instruments that measure mass, weight, and volume and they calculate the...
Curated OER
Measurement: Using the balance
Students use a balance and gram cubes to measure several different objects. They then record their results on a data chart and answer questions about them.
Curated OER
Busted Bubbles
Using the scientific method, and bubble gum, learners conduct a motivating experiment. After conducting a series of tests involving bubble gum, they graph and analyze their results. This is the type of activity everyone loves.
National Nanotechnology Infrastructure Network
The Micro and Macro World Around Us
Don't let your eyes play tricks on you ... use scale to keep your eyes in check! Young scholars observe images without scale and try to identify the structure. Then, they look at the same image with a scale bar and assess whether their...
Curated OER
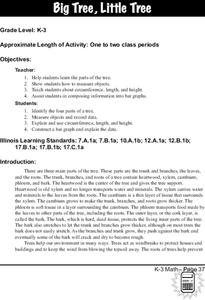
Trees
Students investigate the parts of a tree, measure its circumference and the length and width of its longest branch. The data is compiled and placed into a bar graph.
Curated OER
7th Science Quiz
This seventh grade life science quiz has a professional appearance and well-written multiple-choice questions. However, it seems to cover too broad a variety of biology topics for only 15 questions to fully assess. There is one question...
CPO Science
Science Worksheets
If you need an array of worksheets to augment your science lessons, peruse a collection of assignments that is sure to fit your needs. With topics such as metric conversion, the scientific method, textbook features, research skills,...
Curated OER
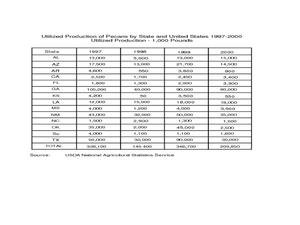
Pecan Power
Students study the origins of pecans and complete a bar graph from the data they have discovered. In this pecan lesson plan, students draw pecans, discuss a pecan time line, and draw a bar graph comparing Arizona pecans to other states.


