Curated OER
How Fast Is Your Car?
Eighth graders discover the relationship between speed, distance, and time. They calculate speed and represent their data graphically. They, in groups, design a ramp for their matchbox car. The goal is to see who's ramp produces the...
Curated OER
Count The Letters
Students perform activities involving ratios, proportions and percents. Given a newspaper article, groups of students count the number of letters in a given area. They use calculators and data collected to construct a pie chart and bar...
Curated OER
Distribution of children living at home
Students use E-STAT to examine demographics. In this social demographics lesson, students use statistical data to determine if a particular family is in need of assistance. Students will discuss social and educational policies and...
Curated OER
Global Warming Statistics
Learners research and collect data regarding temperature changes for a specific location and find the mean, median, and mode for their data. In this climate change lesson plan, students choose a location to research and collect data...
Rainforest Alliance
Forests of Guatemala
With 90 percent of its land area covered in forests, Suriname, a country in South America, contains the largest percentage of forests throughout the world. Here is an activity that brings classmates together to learn about the...
Curated OER
Manage Soil
Students identify and classify soil ypes according to data on the soil triangle. Given examples, students identify soil conservation practices, using criterion assessment instrument. When giving a case situation involving soil...
Curated OER
Graphing and Analysis of Water Quality Reports
Students practice making graphs and interpreting them. They compare and contrast different sets of data. They use Microsoft Excel to create different types of graphs.
Curated OER
Health of Aquatic Life a Real Problem
Learners explore the health of aquatic life in this science lesson They measure and track the oxygen level in the water to determine the health of the aquatic life. They collect this data using the TI explorer to graph and analyze their...
Curated OER
Shake, Rattle and Roll
Sixth graders explore the causes and effects of earthquakes. They also collect and analyze data in graphs. They also use the Internet to research earthquakes
Curated OER
Ecology of the Dump
Students determine which types of garbage are biodegradable and which are nonbiodegradable. They practice measuring skills, hypothesizing, taking data, and writing a lab report. Students observe the relative biodegradability of metal,...
Curated OER
Addendum to the Written Curriculum: Measuring Solids
Students use standard rulers to measure the length of common classroom items - such as pencils, books, desk tops - in inches and centimeters, and measure weight in pounds. They also answer math questions, such as "How long is the front...
Curated OER
Planning a Road Trip!
Students generate plans for a fictitious road trip. In this time management lesson, students investigate the most effective way to travel the country arriving at specific cities. Students create their plans based on time and distance.
Curated OER
Perceived Overweight and Actual Weight Risk Classification
Students calculate their BMI and compare it to a healthy weight chart. In this health instructional activity, students compare the perception of overweight with healthy weight charts. Students interpret collected data and evaluate their...
Curated OER
Finding the Basal Area of a Forest Plot to Determine Stocking Levels
Learners use graphs and plots to measure the basal area and stocking levels. In this graphing instructional activity students work in the field the use their data to help them complete a lab activity.
Teach Engineering
Flow Rates of Faucets and Rivers
Go with the flow and use a helpful resource. A set of two activities has learners investigate flow rates. They first determine the flow rate of a faucet by measuring how long it takes to fill a bucket. Using the results, they make a...
Curated OER
More Jelly Bean Math
Students use their color categorized jelly beans to find the range, mean, median and mode. They use their recorded data documenting how many jelly beans there are for each color in order to calculate the range, mean, median and mode of...
Curated OER
Sun Friendly Homes
Students design and build a model solar energy home. In this technology lesson, students test the efficiency of their model houses by measuring temperature at regular intervals. They analyze data and share results with the class.
Curated OER
Household Conservation/Efficiency
Hook your class up to an online home energy usage calculator so that they can estimate the amount used per month by their families. Then give them Watt meters with which they will measure the power consumption of several small...
Curated OER
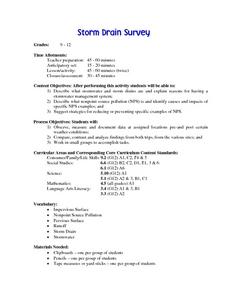
Storm Drain Survey
Young scholars describe what stormwater and storm drains are. They explain reasons for having stormwater management system. They describe nonpoint source pollution and identify causes and impacts of it.
Curated OER
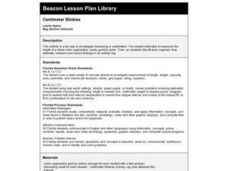
Centimeter Slinkies
Third graders estimate and measure the length of a whole color-segmented, candy gummy worm. Then, as students bite off each segment, they estimate, measure and record findings in an activity log.
Curated OER
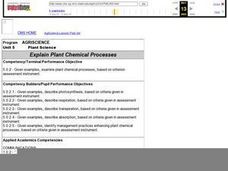
Explain Plant Chemical Processes
Students discover plant chemical processes through three lab activities. Overheads, data sheets, and teaching procedures provided for the unit covering photosynthesis, respiration, and transpiration.
Curated OER
Altering a Plant Environment
Students investigate what a controlled group is by creating an experiment. In this plant growth lesson, students identify the different parts of a plant and discuss what is needed for a plant to be successfully grown. Students grow a...
Curated OER
Sunlight and Plants
Students design and conduct an experiment to discover the role of direct sunlight on plants during germination and after germination. They plant corn and lima beans in small containers which they place in direct sunlight from a window...
Texas Instruments
Golden Ratio Lab
Learners investigate the Golden Ratio in this algebra I or geometry lesson. They explore the Golden Ratio as the conduct an experiment in which they collect various measurement from their team members and find the regression equations...


