Curated OER
Data Analysis
Young statisticians use and interpret measures of center and spread such as mean, median, and mode as well as range. They use box plots to represent their data and answer questions regarding the correspondence between data sets and the...
Teach Engineering
Tools and Equipment (Part 1)
Looking for the best inclined plane for the job? Groups calculate the theoretical mechanical advantage for four different inclined planes. They determine the actual mechanical advantage by measuring the amount of force needed for the...
Teach Engineering
Making Moon Craters
Create an egg-citing study of energy. Pupils investigate the effect of height and mass on the overall amount of energy of a falling object. The fourth segment in a six-part series on energy uses a weighted egg falling from different...
Curated OER
Spoonfuls, Cupfuls and Handfuls
Explore the use of non-standard units for measuring volume with elementary learners. They fill a container and count the number used using cups, spoons, and bottles, build with blocks and count the number of blocks used, and compare and...
Curated OER
"Who am I?"
Pupils of all ages work in pairs to find information about themselves and record a digital "Who am I?" They observe and measure each other, write clues, and illustrate before having others guess who is described.
Curated OER
Dinosaur Math
Second graders practice vocabulary related to measurement, mathematics, and dinosaurs. Using the engaging topic of dinosaurs, learners will calculate various information about dinosaurs and use measurement vocabulary. They will also...
Teach Engineering
Determining Densities
Don't be dense—use a robust resource. The second installment of a five-part Floaters and Sinkers unit has learners determine the densities of several objects. As part of the activity, they learn the displacement method for finding...
Curated OER
Starting With Stats
Statisticians analyze a data set of student IQs by finding measures of central tendency and dispersion such as mean, median, mode, and quartiles. They practice using a graphing calculator to find the values and analyze box plots and...
Curated OER
Division for Third Graders
Explore division and measurement relationships with your math class. They will work in pairs to measure and cut a piece of cord 100 centimeters or longer. Then they cut off equal pieces of less than 10 centimeters until all the cord is...
Curated OER
Calculating Stride Length
How many steps does one take to walk a mile? The number of steps one walks in a mile would definitely depend on the length of his stride. Shorter people may take shorter strides, and taller people may take longer strides. This activity...
Teach Engineering
How Effective is Your Sunscreen?
Protect skin from UV radiation! Groups design and conduct an experiment to test the effectiveness of UV safety products. The groups collect the data from the experiment and prepare a lab report. In the second day of the activity,...
Curated OER
Statistics Canada
Students practice using graphing tools to make tables, bar charts, scatter graphs, and histograms, using census data. They apply the concept of measures of central tendency, examine the effects of outliers. They also write inferences and...
Teach Engineering
Spring Away!
The last segment of the nine-part unit makes a connection between springs and linear equations. Groups hang weights from the spring and measure its length. Then, using the data collected, they calculate the slope to find the k-value of...
Teach Engineering
Exploring Bone Mineral Density
Bone up on bone density. The second installment of the seven-part series has pupils read articles on two different websites to learn about bone density and its measurement, as well as X-rays and other imaging tools. A quiz assesses their...
Illustrative Mathematics
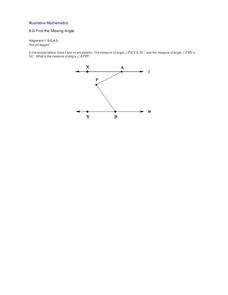
Find the Missing Angle
This one activity requires young geometers to pull together information they are currently learning with things they have learned previously. Here they rely on understanding something about parallel lines, alternative interior angles,...
Teach Engineering
Ice, Ice, PV!
Knowing the temperature coefficient allows for the calculation of voltage output at any temperature. Groups conduct an experiment to determine the effects of temperature on the power output of a solar panel. The teams alter the...
Curated OER
Exercise and the Human Heart
Interpret data and learn about the human heart in one activity! After learning about the way blood flows in the body, fifth graders answer two questions about a graph displaying pulse rate. They then take their own pulses to find the...
Howard Hughes Medical Institute
Ocean Acidification
Human impacts on the environment can sometimes be difficult to measure, especially under water! An activity centered on ocean acidification gives science scholars the opportunity to examine the effects of carbon dioxide on marine life....
Curated OER
Math in the Wetlands Field Trip
Get your class out in the environment for hands on math activities. In this wetlands lesson plan, learners transplant native plants, calculate how much soil is needed, and perform math activities based on this experience. They then make...
Baylor College
Do Plants Need Light?
Turn your classroom into a greenhouse with a lesson on plant growth. First, investigate the different parts of seeds, identifying the seed coat, cotyledon, and embryo. Then plant the seeds and watch them grow! Measure the new plants...
Shodor Education Foundation
Stem and Leaf Plotter
The key is in the leaves. Pupils enter data to create a stem-and-leaf plot. The resource then displays the plot and calculates the mean, median, and mode of the data. Using the plot and the calculated measures of spread, learners analyze...
Yummy Math
Raspberry Chocolate Heart Cake
Have you ever finished a piece of cake and wished you had more? Solve this common dilemma with math! A straightforward worksheet prompts middle schoolers to use the given dimensions of a heart-shaped cake when planning to bake two larger...
Curated OER
Dependence of Light Intensity on Distance
Hopefully you have a sensor interface for your physics class to use with graphing calculators when collecting data with a light sensor. If so, read on. Use this resource for learners to predict and then test whether or not the intensity...
Teach Engineering
Better By Design
Which modification is the best? Using the scientific method, pairs determine the effects of each control surface on the distance of a glider's flight. The activity, section 16 in a 22-part unit on aviation, allows pupils to gain a better...


