Curated OER
3.14159265
Students discover the value of Pi. In this value of Pi lesson, students measure the circumference and diameter of various circles on their graphing calculator. Students find the ratio of the circumference to the diameter and...
Curated OER
Electric Hoist Problem
Students convert angle measures between degrees and radians. They are given a copy of the task sheet with a graphic to help describe the situation. Pupils review the angle and arc relationship in a circle related to length of the...
Curated OER
Let's Do the Wave!
Students distinguish waves from matter, differentiate between transverse and longitudinal waves, use sine curves as representations of transverse waves, label characteristic properties of waves, diagram transverse waves having specific...
Curated OER
Metric Mania
In this metric system learning exercise, students convert measurements of volume from the English system of measurement to the metric system. They also convert within the metric system and answer questions about volume measurements.
Curated OER
Starlight, Star Heat
In this stars worksheet, students read how astronomers calculate the temperature of a star by measuring its color. Students use a chart showing star temperatures and colors to complete 3 short answer questions.
Curated OER
Perpendicular Segments in a Circle
High schoolers explore the concept of circles as they construct a circle using a program such as Cabri Jr. Learners construct a chord and a diameter that are perpendicular, then measure the bisected chord and notice that both sides of...
Texas Instruments
Investigating Segments in a Quadrilateral
Investigate the properties of the shape formed by connecting the midpoints of adjacent sides of a quadrilateral. In this properties of the shape formed by connecting the midpoints of adjacent sides of a quadrilateral lesson, young...
Curated OER
Aurora to Magnetosphere Global Exploration
In this magnetosphere global exploration worksheet, students read about the instrument on board a satellite launched by NASA called the Radio Plasma Imager. This imager detects echoes from plasma clouds. Students calculate the distance...
Curated OER
Here's the Pitch
Young scholars define pitch, measure varying amounts of water into containers, make predictions about the sounds made when striking the containers, put containers in order from highest to lowest pitch, and create their own sound patterns...
Curated OER
Comparing Data
Eighth graders create a survey, gather data and describe the data using measures of central tendency (mean, median and mode) and spread (range, quartiles, and interquartile range). Students use these measures to interpret, compare and...
Curated OER
Volcanic Panic!
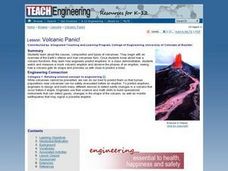
Learners begin with an overview of the Earth's interior and how volcanoes form. They learn how engineers predict eruptions. In a class demonstration, students watch and measure a mock volcanic eruption and observe the phases of an...
Curated OER
Volume of Gas
Eighth graders investigate the effect of temperature on the volume of a gas in a closed container. They measure the height of the water in their beaker/container, conduct their experiment, and create a graph to illustrate their data.
Curated OER
Discovering The Power Of Sunlight
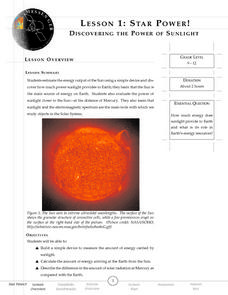
Students participate in a lesson plan that looks at the potential for energy from sunlight. Students conduct research from a variety of resources and construct an object that is used to measure the energy of sunlight and calculate the...
Curated OER
Air Pressure & Barometers
Fourth graders observe, measure, and record data on the basic elements of weather over a period of time (i.e., precipitation, air temperature, wind speed and direction, and air pressure). Then, they make a barometer and keep record of...
Curated OER
The Grating Spectrometer; Light and Wavelengths
Learners create a paper model that demonstrates wave interference for 3 wavelength from 2 sources. In this light and wave lesson, students use a real spectrometer and observe and measure the wavelength of spectral lines. Learners then,...
Curated OER
Daily Weather Log
In this weather worksheet, students keep a log of the temperature, precipitation, air pressure, humidity and wind for a fourteen day period. They record each of these measurements twice a day.
Curated OER
How Fast Does the Sun Spin?
In this rotation of celestial bodies worksheet, students determine the speed of the sun's rotation and they determine the number of days it takes the sun to rotate once at the equator. They identify the geometric factor that causes...
Curated OER
Hands-On Weather Data Collecting
Fifth graders study weather in their community, in the United States, and around the world. They use thermometers, the beaufort wind scale, and simple weather symbols to measure and record the weather outside their school. They also look...
Curated OER
Pop Rocket - Trash to Treasure
First off, Newton's laws of motion aren't often taught at 2nd grade, so this lesson may be more appropriate for upper elementary learners. It begins with a discussion and demonstration of the laws of motion, and then has individuals...
Curated OER
"Use an Anemometer," said the Meteorologist
Learners participate in an hands-on construction of an instrument to measure wind speed.
Polar Trec
Playground Profiling—Topographic Profile Mapping
The Kuril islands stretch from Japan to Russia, and the ongoing dispute about their jurisdiction prevents many scientific research studies. Scholars learn to create a topographic profile of a specific area around their schools. Then they...
NOAA
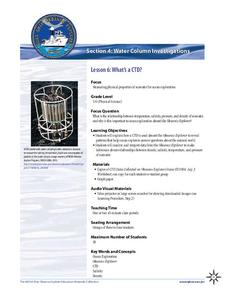
What's a CTD?
Why are the properties of the water important when exploring the ocean? Young scientists discover the tools and technology used in deep sea exploration in the fourth installment in a five-part series. Groups work together to...
PBS
Twirling in the Breeze
Blow classes away with a hands-on lesson investigating wind speed. Learners use common materials to design and construct anemometers. They then test their anemometers and collect data on the wind speed created by a fan.
Mathematics Assessment Project
Solving Problems with Circles and Triangles
After completing a task involving examining the ratio of areas of triangles and circles in a given figure, scholars examine sample responses to identify other strategies they could use to solve the problem.


