Curated OER
Portable Sundial
Students work together to identify the accuracy of sundials. They track the position of the sun and create a shadow plot. They discover the difference between real time and clock time.
Curated OER
What's The Matter?
Fourth graders accurately describe various states of matter, Through experimentation, they change a variable to create a new state of matter. Students record their observations about the way matter is changed and the changes that occur...
Curated OER
Science Experiments - The Low-down
Third graders discover the process thinking about science experiments, and why they are important. They work in small groups using incline planes and a small toy car to design one scientific question that can be answered through...
Curated OER
When Disaster Strikes! Rocks, Minerals, Erosion and Weather
Pupils pretend the area they live in is subject to wind, waves and rain. In groups, they pretend they are a groups of meteorologists or geologists and are to report on the weather and damage that could occur there. Each group develops a...
Curated OER
Weather Station
Students create their own barometer, precipitation, rain gauge, anemometer, and more with their weather stations. In this weather station lesson plan, students access on line websites on how to make their own weather tools.
Curated OER
Revolutions in the Solar System
Third graders conduct research on the solar system. In this solar system lesson, 3rd graders will work in groups of four to create a power point presentation from their findings. They divide the research amongst the members in their...
Curated OER
Triangle Inequality Theorem
Students identify properties of triangles. In this geometry lesson, students create triangles using three different segments. They make conjectures and predictions.
Curated OER
The Unit Circle
Students solve problems using the unit circle. In this precalculus lesson, students identify angles using the properties of the unit circle. They observe the trigonometric graphs and sine, cosine and tangent.
Curated OER
Analyzing Country Data
Students analyze different data in percentage form. In this statistics lesson, students plot data using box-plots, dotplot, and histogram. They compare and contrast the collected data using the boxplot.
Curated OER
Center and Spread
Students collect and analyze data. In this statistics lesson, students define and calculate the range, median and standard deviation. They identify reasons for a skewed distribution.
Curated OER
Sampling Distributions
Students analyze sampling from different population. In this statistics lesson, students define the meaning of sample sizes and what causes an increase or decrease. They graph their data on the Ti calculator and draw conclusion from the...
Curated OER
Modeling Drug Assimilation in the Human Body
Students investigate the accumulation of drugs in the body. In this algebra lesson, students collect data on drug retention and assimilation. They use their data to predict the behavior and effects of drugs.
Curated OER
The Hudson's Ups and Downs-Hudson River Activity
For this Hudson River worksheet, students read a short passage about the river, compare graphs of water levels at different locations, label high and low tides on a graph and interpret, and answer comprehension questions based on several...
Curated OER
Chronic Conics
Fourth graders use two activities to draw four different conic sections. One activity is of a physical nature and one is traditional paper and pencil.
Curated OER
Celsius Tells Temperature, Too
Second graders become aware that thermometer liquids expand or contract as temperature affects them.
Curated OER
Glucose Factory
Fourth graders determine, through laboratory activity, the presence or absence of glucose in a variety of plant leaves and stems. They work in groups and perform a three part laboratory which shows them how plants convert sunlighht to food.
Curated OER
This Lesson Is a Breeze, So Don't Blow It!
Learners conduct an experiment to show that air is all around us and that wind is the movement of air. They construct a weather vane to determine which direction the wind is blowing.
Alabama Learning Exchange
Researching Hurricanes with Technology
High schoolers explain the components that make up a hurricane.
Curated OER
Let the North Star Tell You Where You Are
Students create an astrolabe and locate the North Star in the night sky. They determine the latitude of the North Star, and calculate an average latitude based on class results.
Curated OER
The Greatest Survival Story of All Time
Students use the Internet to read about an explorer's survival in the Antarctic. They try to find a better route for him to have taken.
Curated OER
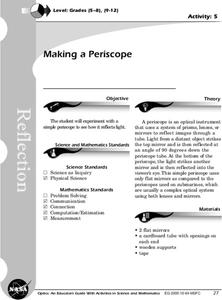
Making a Periscope
Young scholars experiment with a simple periscope to see how it reflects light. They draw a diagram of the path a ray of light follows as it travels from an object, through the periscope, and into your eye.
Curated OER
The Energy of Music
Learners discover how engineers use sound energy. They participate in hands-on activities in which they discover how we know sound exists. They identify different pitches and frequencies as well.
Curated OER
Do Different Colors Absorb Heat Better?
Students work together to test how the color of a material affects how much heat it absorbs. They make predictions and take notes on their observations. They discover how engineers use this type of information.
Curated OER
Population Dynamics (Lesson 2)
Middle schoolers discuss the importance of population growth rates. They examine mortality and survival curves and participate in an experiment. They record their observations and discuss.


