Curated OER
Know Your Angles
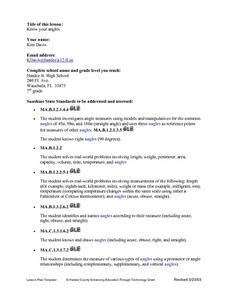
Explore types of angles and the characteristics of each. After observing a PowerPoint Presentation, learners tour the school facilities and use a digital camera to capture prescribed angles. Using the digital pictures and written...
Curated OER
Area and Volume Metric Conversions - Grade Seven
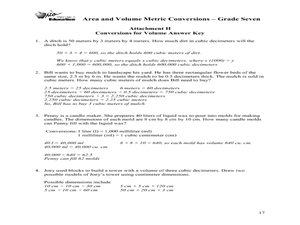
Middle schoolers investigate unit conversion. In this unit conversion lesson, students will build models of square and cubic centimeters using grid paper and generate formula tables for converting units of area and volume. The tables...
Illustrative Mathematics
Equations and Formulas
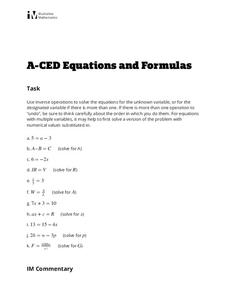
Your class is asked to use inverse operations to solve eleven equations for unknown variables or to rearrange formulas to highlight a quantity of interest. By using the same reasoning as solving one- and two-step equations, algebra...
Pennsylvania Department of Education
Build What I've Created
n this geometric lesson plan, students define and identify two dimensional shapes based on their attributes. They complete worksheets based on the geometric concepts.
Curated OER
Speed
Fifth and sixth graders practice working in pairs to determine whether they can walk with constant speed. They test themselves, collect their data, draw graphs with their data collected, manipulate the data, and then draw conclusions...
Willow Tree
Scientific Notation
Numbers that are very large or very small are difficult to express in standard notation. Pupils learn how to convert between standard and scientific notation. They also multiply and divide the numbers in scientific notation.
Curated OER
A Matter of Fact
Students design their own Science experiment. In this science experiment lesson students create a hypothesis related to matter and test it. They displayed their data in a graph.
Curated OER
What's Poppin'?
Second graders determine and compare weights and volumes of popped and unpopped corn to make predictions and solve problems. Students combine the data of each group into a graph. They construct questions, statements and story problems...
Curated OER
GUM: More, Less, or the Same?
Pupils confirm the law of conservation of matter by weighing chewing gum before and after it is chewed.
Alabama Learning Exchange
Density
Students observe a demonstration of regular soda versus diet soda. In this exploring density instructional activity students complete a lab on density and present a PowerPoint presentations of their results.
Curated OER
Fractions, Decimals, and Gravity
Students discuss how weight is directly related to gravitational force on a planet. Students then choose Space Traveler as companion and compute how much their guide weighs on various planets, based on each planet's relative surface...
Curated OER
Perplexing Perimeters
In the process of constructing their own "rulers" Students develop a sense of the size of a centimeter and meter. Students select the appropriate "ruler" for the tasks. Finally, 3rd graders calculate the perimeter of objects using...
Curated OER
Imperial Units
In this converting imperial units worksheet, learners complete converting 12 metric units from imperial units to metric or vice versa.
Curated OER
Converting weight from decagrams to decigrams
Sixth graders practice weight conversions in grams. In this conversion lesson, 6th graders convert weights from kilograms all the way to milligrams. They complete word problems with grams of rice.
Curated OER
More Bait for Your Buck!
Students determine where to buy the heaviest earthworms as they study invertebrates. They create a double bar graph of the results of the weight data.
Curated OER
Oranges and Stopwatches
Learners begin to recognize that objects have many measurable attributes. They examine how to identify and accurately measure attributes of common objects. Also Students report their measurement findings.
Curated OER
Lesson Plan: Using Maps and Scales to Get to the Basketball Hall of Fame
Learners view a quicktime video of basketball players going from Atlanta to Springfield, Mass. For this scaling lesson, students use a map to calculate the distance of the trip and the length of travel time. Learners apply ratio and...
Curated OER
Tick Around the Clock
Students examine and discuss the differences between clocks they are shown. Using the internet, they research how people used to tell time before clocks. They review what the long and short hand on the clock represent and practice...
Curated OER
Telling Time to 5 Minutes
In this second grade lesson your class will practice telling time. The goal is to tell time to five minutes using an analog clock. Your young students count by 5 minute intervals and discuss elapsed time.
Curated OER
Making Logic Out of Madness
Tenth graders organize and interpret data from a student health program. In this physical education activity, 10th graders use a body composition analyzer over 8 weeks to determine the validity of a student health program. Data...
Curated OER
Maximize It!
Students design a rectangular box without a lid that has the largest possible volume using the supplied sheet of centimeter graph paper. They work in groups to construct different size boxes to determine the largest possible volume and...
Curated OER
Volume of Rectangular Prisms
Introduce the procedure needed to find the volume of a rectangular prism. Learners rank various prisms such as cereal boxes and tissue boxes from smallest to largest volume. They use an applet to find the volume and surface area of each...
Mabry MS Blog
Scatter Plots
Scatter plots are a fun way to gather and collect relevant data. The presentation goes through several examples and then describes the different types of correlation.
Curated OER
Maps and Modes, Finding a Mean Home on the Range
Fifth graders investigate data from maps to solve problems. In this data lesson, 5th graders study maps and collect data from each map. Students present their data in a variety of ways and calculate the mode, mean, median, and range.


