Curated OER
Measuring Units and Tools
In this measurement instructional activity, students determine which of 3 measurement tools would be used to answer 4 mathematical questions. Students circle their multiple choice answers and then draw or write an explanation for each...
American Chemical Society
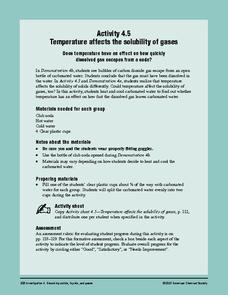
Temperature Affects the Solubility of Gases
Dare your class to drive dissolved carbon dioxide out of carbonated liquid at different temperatures to discover if there is a difference in rate. To make this experiment more sound, have explorers use equally measured amounts of soda...
Curated OER
The Effect of Dissolved Salt on the Boiling Point of Water
Explore the properties of solutions with a lab activity. Chemistry fans determine the boiling point of water, add salt to create a solution, and then repeat the process four more times. They design their own data table and then graph the...
Curated OER
2005 Grade 8 Science Released Test Questions
Here is a collection of 22 multiple-choice questions on topics from the physical and life sciences. Apparently they came from an 8th grade comprehensive science exam and have been released for public use. They may serve as a sufficient...
Curated OER
Graphing Water Temperature
Students graph water temperature using probe software and a Palm on a class field trip to a lake or pond. Emphasis is placed on collaboration with high school science students and the use of ImagiProbe software.
Nuffield Foundation
Measuring Respiratory Quotient
How do scientists prove tiny living things respire? Young scientists build a respirometer and measure respiration rates in living creatures. By comparing the measurements of both plants and animals, they understand the similarities.
Science 4 Inquiry
Investigating How Heat Flows
It is impossible to cool down a glass of water by adding ice. Young scientists explore heat transfer through videos, experiments, and interactive games. They quickly catch on that the water melts the ice and things aren't always as they...
Curated OER
Cold, Clouds, and Snowflakes
Students explore satellite data and graphing. In this weather data analysis math and science lesson, students analyze NASA satellite data to draw conclusions about geographical areas where precipitation might have happened. Students...
Curated OER
#24 How Much Air Is In Foamed Polystyrene Products?
Students are challenged to come up with a good estimate of the amount of air in foamed polystyrene products. They use this gas evolution experiment and as such have students measure the gas generated when foamed polystyrene is degassed...
Curated OER
The Cloud Case
Students discover how clouds form and how air pressure and air temperature affect their formation. The lesson plan is delivered in the story of Mike Breezy, Air Detective, who tries to solve The Cloud Case.
Curated OER
Liquid Rainbow
Students develop their own techniques for drawing a small sample of solutions into a straw. They hypothesize ways to increase the density of water, and discuss how salt-free rainwater tends to float on top of salty seawater.
Curated OER
Lead and Mercury Ion Catalase Inhibition
Students participate in a laboratory investigation in which they observe the effect of temperature and pH on enzyme activity. Students also examine exposure to heavy metal ions and the effect that may have on enzyme activity.
Beyond Benign
Exothermic and Endothermic Reactions
How can you tell the difference between endothermic and exothermic reactions? Chemistry scholars perform and observe two chemical reactions, measure the temperature throughout, then draw conclusions about changes in energy from their...
Curated OER
Fahrenheit Follies
Second graders analyze the effects of sunlight on a glass of water by using the thermometer to measure its temperature. They predict and measure the difference between water outside in the sun and shade and inside. They role-play a game...
Curated OER
Graphing Toad/ Frog Respiration
Students measure respiratory rates on live toads, and the effect water temperature has on their findings. In this scientific method lesson, students record their findings and present them in a graph, comparing the results.
NOAA
Ground-truthing Satellite Imagery with Drifting Buoy Data
Ground-truthing ... is it even a word? The last installment of a five-part series analyzes how scientists collect sea surface temperature data. Scholars use government websites to compare temperature data collected directly from buoys...
NOAA
Ocean Layers I
How is it possible for ocean water to have layers? The sixth installment of a 23-part NOAA Enrichment in Marine sciences and Oceanography (NEMO) program investigates factors that cause different water densities to occur. Experiments...
DiscoverE
Solar-Heated Water
Heat up some interest in solar energy. Young engineers create a water heater that runs on solar power (simulated by a lamp). Using thermometers, they determine the change in temperature before and after the water goes through the heater.
Curated OER
Water:Properties, Chapter 3
Hydrogen bonds, and polarity are described in this PowerPoint, and the reasons for tension and cohesion associated with water. The states of water under certain conditions are explained with information about the changes in density and...
NOAA
Technology I
Isn't technology great? The 12th installment of a 23-part NOAA Enrichment in Marine sciences and Oceanography (NEMO) program introduces technology that marine scientists use. Pupils take part in an activity using conductivity,...
US Department of Energy
Effects of Solar Radiation on Land and Sea
Earth science enthusiasts experiment to compare the heating rates of soil and water. They relate their findings to the weather conditions near bodies of water. Consider also having middle schoolers measure the cooling rates to...
Curated OER
Thermal Pollution
In this pollution worksheet, students read about thermal pollution and how hot water affects wildlife. Then students complete 1 short answer question.
Curated OER
Temperature
In this temperature learning exercise, students conduct an experiment including water, measuring cups, a funnel, and more, to see how temperature affects ocean currents. Students read 5 directions and answer 7 questions.
Curated OER
What's A Water Column Profile?
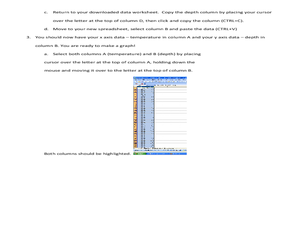
Learners investigate water column data. In this earth science and seawater instructional activity, students determine how temperature, salinity, and density have an impact on sea water by viewing and analyzing data obtained from a number...


