EngageNY
Summarizing Bivariate Categorical Data
How do you summarize data that cannot be averaged? Using an exploratory method, learners complete a two-way frequency table on super powers. The subject matter builds upon 8th grade knowledge of two-way tables.
Achieve
BMI Calculations
Obesity is a worldwide concern. Using survey results, learners compare local BMI statistics to celebrity BMI statistics. Scholars create box plots of the data, make observations about the shape and spread of the data, and examine the...
Statistics Education Web
Now You SeeIt, Now You Don't: Using SeeIt to Compare Stacked Dotplots to Boxplots
How does your data stack up? A hands-on activity asks pupils to collect a set of data by measuring their right-hand reach. Your classes then analyze their data using a free online software program and make conclusions as to the...
Statistics Education Web
Consuming Cola
Caffeine affects your heart rate — or does it? Learners study experimental design while conducting their own experiment. They collect heart rate data after drinking a caffeinated beverage, create a box plot, and draw conclusions....
Statistics Education Web
Saga of Survival (Using Data about Donner Party to Illustrate Descriptive Statistics)
What did gender have to do with the survival rates of the Donner Party? Using comparative box plots, classes compare the ages of the survivors and nonsurvivors. Using the same method, individuals make conclusions about the...
Inside Mathematics
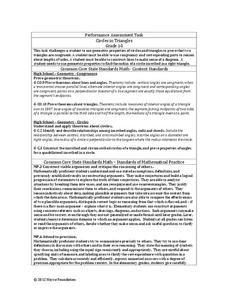
Circles in Triangles
Challenge the class with inscribed circles in triangles. The assessment task requests class members use their knowledge of circles and right triangles to prove two triangles are congruent. They go on to utilize their knowledge of...
Curated OER
Word Problems That Involve the Mean
In this online worksheet, students solve 5 word problems. Each problem requires students to calculate for x.
Illustrative Mathematics
Speed Trap
In which direction is traffic moving faster, north or south? Use box and whisker plots to organize data and interpret the results. Detailed solutions are included. This activity would be good as a warm up or quick assessment at the...
Illustrative Mathematics
Puppy Weights
Nobody can say no to puppies, so lets use them in math! Your learners will take puppy birth weights and organize them into different graphs. They can do a variety of different graphs and detail into the problem based on your classroom...
Curated OER
Clam Challenge
In this clams worksheet, students explore clam characteristics. Students complete nine multiple choice questions about clam facts.
Curated OER
Clam Vocabulary
In this clam vocabulary skills worksheet, students match the 9 clam-related terms in the word bank to the appropriate definitions.
Curated OER
Clam Crossword
In this clams crossword puzzle worksheet, students use the 10 clues and the terms in the word bank to help them correctly complete the word puzzle.
Curated OER
Make a Frequency Table and a Histogram for a Given Set of Data
In this data recording and data organization worksheet, students create one frequency table and one histogram for a given list of data. Explanations and examples for frequency tables and histograms are given.
Curated OER
Mean and Standard Deviation
Get two activities with one lesson. The first lesson, is appropriate for grades 6-12 and takes about 20 minutes. It introduces the concept of measures of central tendency, primarily the mean, and discusses its uses as well as its...
Curated OER
Grammar Worksheets: Who or Whom?
Who or whom? Do your young grammarians need extra practice using interrogative pronouns correctly? The seven sentences in this exercise will provide that opportunity; however, the worksheet does not provide definitions, examples, or an...
Georgia Department of Education
The Basketball Star
Have learners use math to prove they are sports stars! Assess a pupil's ability to create and analyze data using a variety of graphs. The class will be motivated by the association of math and basketball data.
Teach-nology
Using the Thesaurus: Synonyms
Kids are asked to choose the one option that is not a synonym for the provided keyword on a synonym worksheet.
Curated OER
Measures of Central Tendency
For this Algebra I worksheet, 9th graders determine the measures of central tendency for a given data set. The one page worksheet contains four problems. Answers are provided.
Curated OER
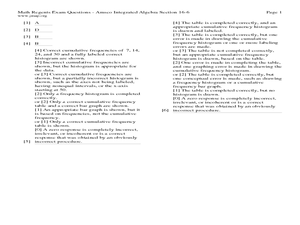
Regents Exam Questions G.G.21: Centroid, Orthocenter, Incenter, and Circumcenter
In this triangles worksheet, students solve 4 multiple choice problems. Students find the centroid, orthocenter, incenter, and circumcenter or various triangles.
Curated OER
Lines of Slope
In this lines of slope worksheet, 9th graders solve and complete 40 various types of problems. First, they find the equation of the lines described and write in slope-intercept form. Then, students graph each equation. They also find the...
Curated OER
Analyzing Graphs
In this statistics and probability worksheet, students analyze frequency distribution tables or histograms and box and whisker plots. The two page worksheet contains four multiple choice questions. Answers are included.
Curated OER
Quartiles, Percentiles, and Cumulative Frequency
In this statistics lesson, 11th graders are asked to calculate the percentiles, quartiles and cumulative frequency given different graphs and data. There are 6 questions with an answer key.
Curated OER
Building New Landforms
In this landform worksheet, students read 6 paragraphs about the process the Dutch used to build new landforms and threats they face today. After reading the background information, students complete 3 short answer questions regarding...
Curated OER
Simplifying Expressions
In this simplifying expressions worksheet, 11th graders solve and complete 44 various types of problems. First, they solve for the given variable in each equation. Then, students simplify each expression and factor completely. They also...
Other popular searches
- Mean, Median, Mode
- Mean Median Mode
- Graphing Mean, Median, Mode
- Free Mean, Median, Mode
- Math; Mean, Median, Mode
- Mean Median Mode Range
- Mean, Median, Mode Range
- Mean Median and Mode
- Mathematics Mode and Median
- Median and Mean Statistics
- Mean, Median, Mode, Range
- Mean Median


