Curated OER
Pi Digit Distribution
Young scholars study graphing skills and compare and contrast data sets. They compute pi through the first 50-100 digits and create a bar graph showing the frequencies of specific digits.
Curated OER
Home, Home in the City
Pupils create a spreadsheet that organizes housing information in the Houston area. They write a formula to determine the average price of homes in the Houston area.
Curated OER
Water You Can Use from the Air Conditioner
Young scholars work together to research water quantity, quality and safety standards. They complete a lab to discover how to use the water from an air conditioner. They write a paper to show their findings.
Curated OER
Exploring Special Segments in Triangles
Students discover that four special segments have a common intersection point. They identify the position of the intersection point in triangles. They produce conjectures about areas of the divided triangles.
Curated OER
Peak Load Growth Along the Wasatch Front: What's Driving Electricity Demand in Utah?
Young scholars study how electricity is used in Utah. They create an advertising plan to educate consumers about peak cycles and energy costs for the cycling service of electricity. They present their advertising plan to the class for...
Curated OER
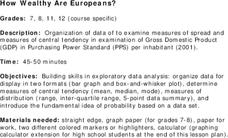
How Wealthy Are Europeans?
Students investigate measures of central tendency. They examine compiled data and conduct critical analysis. The graph is focusing on the gross domestic product data. The instructional activity also reviews the concept of putting values...
Curated OER
Measuring "pHacts" about Acid Rain
Sixth graders gather and graph information regarding the pH of rain. Working cooperatively with an internet partner, 6th graders gather and record information about the pH of the rain in their local area. They graph this information...
Curated OER
Inside the Vault-Employment Growth in America: What Determines Good Jobs?
Students examine employment growth and the economy. After a teacher lead discussion, students explore types of jobs and their correlation with education level. Job qualifications for both high-paying and low-paying careers are researched.
Curated OER
Words To Numbers
Seventh graders explore the four steps to problem solving. After observing a problem solving chart and discussing each step, 7th graders solve individually assigned word problems. Upon completion, they share their information with the...
Curated OER
Salaries
Students are engaged in the study of salaries and how they vary according to different occupations. They conduct research using a variety of resources in order to summarize the earnings potential in the human services field.
Curated OER
"M&Ms"® Candies Worksheet 1
In this math worksheet, students find the likelihood of different outcomes with the use of M and M's candy for the seven questions and fill in the graphic organizer.
Curated OER
Vocabulary: Talking About the Weather-2
In this foreign language worksheet, students fill in the blanks for 10 weather related sentences. Each sentence has a list of three words to select from.
Curated OER
Descriptive Statistics
Young scholars demonstrate how to use frequency and scatter diagrams. In this statistics lesson plan, students are introduced to different techniques of representing data. Young scholars sort and graph data on a worksheet and use a...
Curated OER
Testing Weather Proverbs
Students study weather proverbs. In this weather lesson, students list weather proverbs and complete the worksheet to test the proverb. Students design an experiment to test the weather proverbs and conduct the experiments.
Curated OER
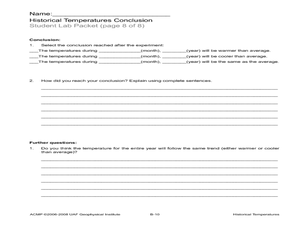
Historical Temperatures
Students research historical regional temperatures for their current season. In this historical weather lesson, students conduct weather station and Internet research to learn about historical regional temperatures. Students collect and...
Other
Sprk: Macro Lab Lesson 3 Mean, Median, & Mode: Teacher Guide [Pdf]
Learners will use Sphero to conduct an experiment. They will identify how long they need Sphero to move at 10% speed to reach and knock over a target object (such as a whiteboard marker). Using this information, they will then calculate...
Alabama Learning Exchange
Alex: The Mean, Median, and Mode Chain Gang
Cooperative learning groups and chain links are used to find the mean, median, and mode. A Science NetLinks instructional activity is linked for further real-life application in the world of baseball (optional). This lesson plan was...
Illustrative Mathematics
Illustrative Mathematics: S Id.3 Describing Data Sets With Outliers
For certain data sets, such as home prices and household or individual income, is often described using the median instead of the mean. This lesson explores the mean and median in some different situations to help you understand the...
Illustrative Mathematics
Illustrative Mathematics: 6.sp4, 5c Puzzle Times
A performance task asking students to create a graph of provided information and then find the mean and the median of the data.
Alabama Learning Exchange
Alex: Estimation Station
During this lesson, students will learn the difference between estimation and guessing. Knowing how to estimate is an essential skill that will help students determine approximate totals as well as check the reasonableness of their...
Better Lesson
Better Lesson: Analyze This! Mean Median Mode and Range
Finding measures of central tendency will be applied to the different graphs throughout this unit.
Shodor Education Foundation
Shodor Interactivate: Lesson: Introduction to Statistics
"The goal of this lesson is to introduce the concepts of mean, median and mode and to develop understanding and familiarity with these ideas." This lesson is provided by Shodor Education Foundation.
Texas Instruments
Texas Instruments: Learning to Do Linear Regressions
This activity compares children's age to height to teach linear regressions. The handout includes notes for students and teachers with a step-by-step lesson plan on how to do three types of linear regressions - Best Fit line, Median Line...
Other
Csulb: Stem: How Much Water Fits on a Penny? [Pdf]
Students explore mean, median, mode, and range with this hands on activity.
Other popular searches
- Mean, Median, Mode
- Mean Median Mode
- Graphing Mean, Median, Mode
- Free Mean, Median, Mode
- Math; Mean, Median, Mode
- Mean Median Mode Range
- Mean, Median, Mode Range
- Mean Median and Mode
- Mathematics Mode and Median
- Median and Mean Statistics
- Mean, Median, Mode, Range
- Mean Median






![Sprk: Macro Lab Lesson 3 Mean, Median, & Mode: Teacher Guide [Pdf] Lesson Plan Sprk: Macro Lab Lesson 3 Mean, Median, & Mode: Teacher Guide [Pdf] Lesson Plan](https://d15y2dacu3jp90.cloudfront.net/images/attachment_defaults/resource/large/FPO-knovation.png)

