Ministry of Education and Universities of the Region of Murcia (Spain)
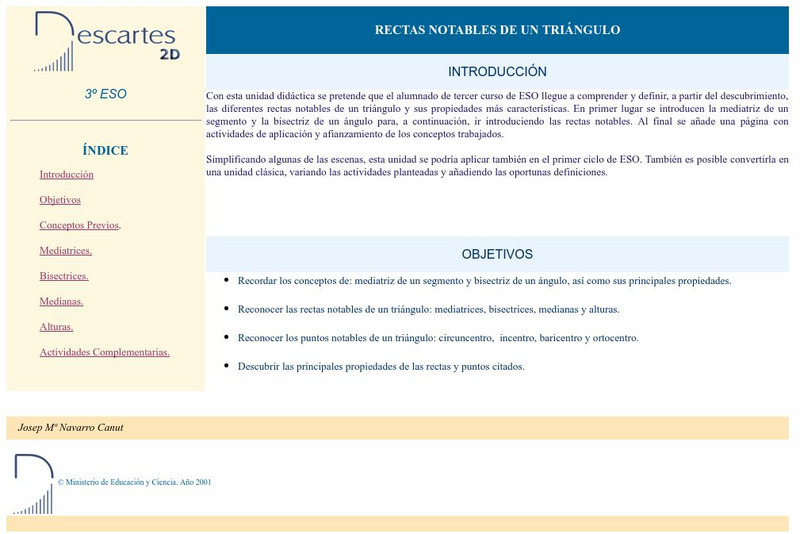
Ministerio De Educacion Y Ciencia: Rectas Notables De Un Triangulo
In Spanish. Interactive activities dealing with the concept of angle bisector, median and altitude of a triangle. A description of the circumcenter and centroid are given along with a visual representation. [Requires Java.]
Other
Raymond Geddes and Company, Inc.: Analyzing Product Price and Sales Data
Lesson plan provides a real-world application of mean, median, mode, and range.
Science Education Resource Center at Carleton College
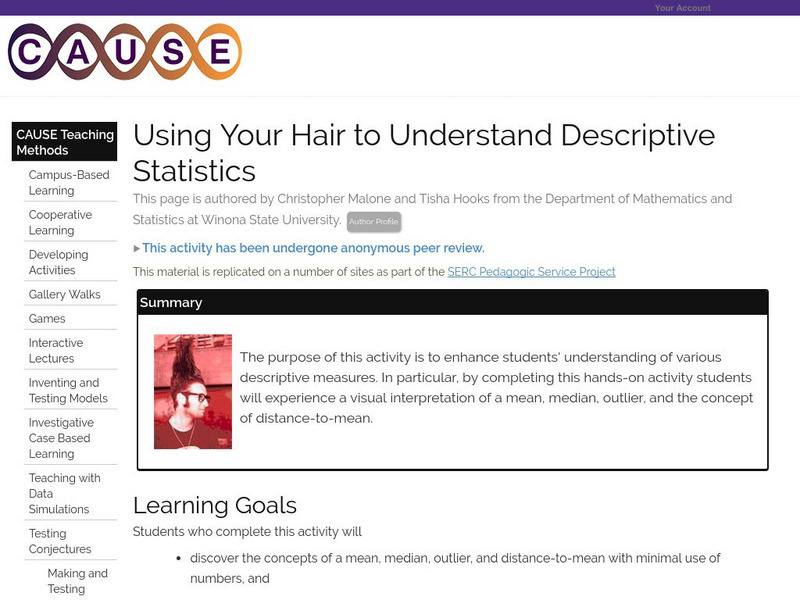
Serc: Using Your Hair to Understand Descriptive Statistics
Enhance students' understanding of various descriptive measures with a visual interpretation of a mean, median, outlier, and the concept of distance-to-mean.
Better Lesson
Better Lesson: Analyze This Part 2!
Srudents connect mean, median, mode and range to real life. It will allow students to make sense of problems by using previously taught strategies.
PBS
Pbs Learning Media: Central Tendency: Targeted Math Instruction
At the end of this lesson plan, students will be able to recognize and apply the concepts of mean, median, and mode in real-life problems.
Science Education Resource Center at Carleton College
Serc: Birds: How Do We Increase the Bird Population at Our School?
This is a lesson plan of how to improve our environment as well as how to enjoy it. The students will sit in the schoolyard, study pictures of birds and then compile similarities and differences. Students will observe live birds in the...
Illustrative Mathematics
Illustrative Mathematics: The Value of Education
The purpose of this task is for young scholars to add, subtract, multiply, and divide decimal numbers in a real-world context. The weekly income earned by each person in the task is the median weekly income for their education level, but...
Alabama Learning Exchange
Alex: My Peanut Butter Is Better Than Yours!
The students will engage in the process of statistical data comparing data using tables and scatterplots. The students will compare data using measures of center (mean and median) and measures of spread (range). This lesson can be done...
Alabama Learning Exchange
Alex: University and College Tuition Webquest
This is a technology-based and interdisciplinary project incorporating mathematics, language, and technology standards. Each student will research on the university's website: location, the mission statement, historical and interesting...
Better Lesson
Better Lesson: Understanding Data!
Fourth graders will gear up to explore how to find the means, median, and modes to represent data.
University of Texas
Inside Mathematics: Baseball Players [Pdf]
This task challenges students to demonstrate understanding of the concept of measure of center.
Illustrative Mathematics
Illustrative Mathematics: 6.sp Puppy Weights
A performance task asking students to create a graph of provided information and then answer two questions about the information provided with that graph.
Council for Economic Education
Econ Ed Link: The Economics of Homebuying
This lesson plan analyzes the costs and benefits of homeownership and asks the student to describe the factors that affect affordability, use cost-benefit analysis and knowledge of home-buying procedures to reduce the costs, analyze the...
University of Illinois
University of Illinois: Data Types
The University of Illinois provides this site that is helpful because of the various kinds of data that can be collected. This lesson plan helps students differentiate between qualitative, quantitative, and many other types of data.
University of Georgia
University of Georgia: Measures of Variation
Lesson plan introduces and explains how to calculate measures of variation concepts such as range and quartile.
Science Education Resource Center at Carleton College
Serc: Nitrate Levels in the Rock Creek Park Watershed: Meas of Central Tendency
Activity uses water-quality data from Rock Creek Park to illustrate elementary statistical measures of exploratory data analysis. The focus of the lesson is the nutrient limitation in a stream and the three measures of central tendency.
PBS
Pbs Mathline: Bubble Mania [Pdf]
Bubble Mania is a lesson plan that focuses on the concept of measurement as it applies to the diameter, circumference, and area in a bubble. Extension activities and connections, related worksheets, and additional resources are included.
Annenberg Foundation
Annenberg Learner: Drawing a Box Plot
Learn how to represent the Five-Number Summary graphically using a box plot.
Shodor Education Foundation
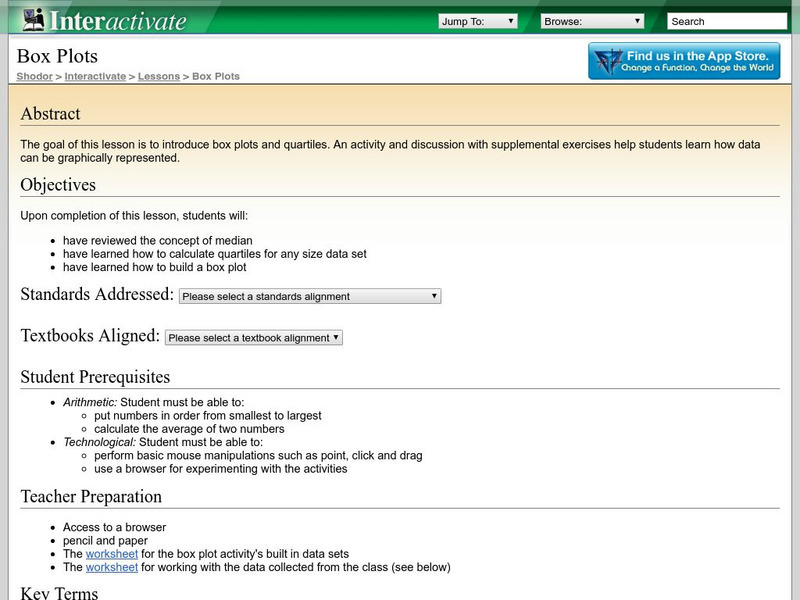
Shodor Interactivate: Lesson: Box Plots
This lesson plan introduces quartiles and box plots. It contains an activity and discussion. Supplemental activities about how students can represent data graphically are also included.
Beacon Learning Center
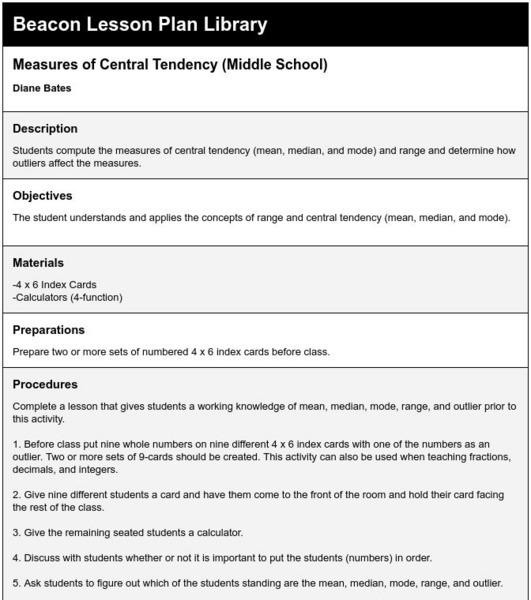
Beacon Learning Center: Measures of Central Tendency (Middle School)
Lesson plan provides practice for calculating measures of center.
Illustrative Mathematics
Illustrative Mathematics: S Id Haircut Costs
This lesson could be used as an introductory lesson to introduce group comparisons. Being able to use data to compare two groups is an important skill. Learners will sketch box plots using the data given about the cost of haircuts for...
Alabama Learning Exchange
Alex: "Ridin' Along in My Automobile"
Students will research prices of used cars to discover how automobiles lose their value over time. Students will create a chart to record their information, use their chart to graph their data, and find measures of central tendency of...
Better Lesson
Better Lesson: What Does the Data Tell Us? Describing Data
Understanding how to interpret data by its shape, spread, and center helps students to understand statistics.
Shodor Education Foundation
Shodor Interactivate: Misleading Graphs
This instructional activity will challenge learners to think creatively by having them design and build water balloon catchers from random scrap materials, while requiring them to take into consideration a multitude of variables...
Other popular searches
- Mean, Median, Mode
- Mean Median Mode
- Graphing Mean, Median, Mode
- Free Mean, Median, Mode
- Math; Mean, Median, Mode
- Mean Median Mode Range
- Mean, Median, Mode Range
- Mean Median and Mode
- Mathematics Mode and Median
- Median and Mean Statistics
- Mean, Median, Mode, Range
- Mean Median


