Curated OER
Statistics
In this statistics worksheet, students solve and complete 6 different problems that include determining various types of statistics. First, they determine the data set where the median value is equal to the mean value. Then, students use...
Curated OER
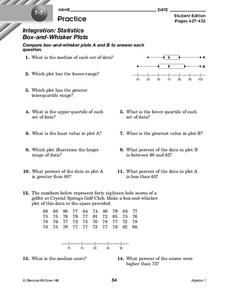
Box-and-Whisker Plots
In this box-and-whisker plots worksheet, 9th graders solve and complete 14 different problems that include comparing various box-and-whisker plots. First, they determine the median for each set of data and plot the lesser range. Then,...
Curated OER
Statistics
In this statistics worksheet, 9th graders solve and complete 10 various types of problems that include using different types of graphs to illustrate data. First, they determine the median score for each stem-and-leaf plot. Then, students...
Curated OER
Scatterplot
In this scatterplot activity, 9th graders solve and complete 7 different problems that include defining various scatterplots. First, they use the data plotted on the scatterplot that represent the best prediction. Then, students use the...
Curated OER
Tricky Averages and Challenging Word Problems
In these two challenging problem solving worksheets, students calculate the mean, median, and mode and apply the results to find which average is best and then solve challenging multiple answers story problems. Students solve 16...
Curated OER
Project Interactive--Stem and Leaf Plotter
In this excellent stem and leaf plotter worksheet, students construct, arrange and write a report of how to interpret the leaves they collect in this data analysis. Students answer 4 detailed questions regarding the data analysis...
Curated OER
Right Triangles
In this right triangles worksheet, 10th graders solve and complete 14 various types of problems. First, they find the perimeter of the isosceles trapezoid shown. Then, students find the measures of each marked side of a right triangle....
Illustrative Mathematics
Puzzle Times
Give your mathematicians this set of data and have them create a dot plot, then find mean and median. They are asked to question the values of the mean and median and decide why they are not equal. Have learners write their answers or...
Curated OER
M&M’s Math Worksheet
Who knew you could cover prediction, histograms, fractions, decimals, data collection, and averages (mean, median, and mode) all with a bag of M&M's®? Here's a fantastic set of worksheets to help you make candy a mathematical journey...
Mt. San Antonio Collage
Isosceles Triangles and Special Line Segments
Under which conditions can a triangle be classified as isosceles? High schoolers practice identifying isosceles triangles and special line segments, including angle bisectors, medians of triangles, and perpendicular bisectors of sides of...
Curated OER
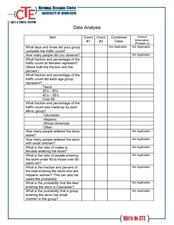
Data Analysis
In this data analysis worksheet, students complete several activities to analyze data. Students calculate the mean, median, mode, and range for the 14 problems.
Curated OER
Quiz: Central Tendency and Dispersion
In this central tendency and dispersion instructional activity, students find the mean, median and mode of a set of numbers. The set of numbers is not included on this instructional activity. They complete a frequency distribution and...
Curated OER
Averages
For this averages worksheet, 6th graders solve and complete 3 various types of problems. First, they find the mean, mode, median and range for each set of data shown. Then, students match each team to the picture shown that they think...
Curated OER
Equation of a Line
In this equation of a line worksheet, 9th graders solve and complete 4 different multiple choice problems. First, they use the median fit method to determine the equation that most likely represents the line of best fit for the data...
Curated OER
Statistics
In this statistics activity, 9th graders solve and complete 5 various types of problems related to determining statistics. First, they determine the data set where the median value is equal to the mean value. Then, students determine the...
Curated OER
Mean, Mode, Range, Median
In this weather worksheet, students look at the average monthly temperatures and precipitation for their own city to determine the mean, mode, range, and median. This worksheet has 8 fill in the blank questions.
Curated OER
Statistics
In this statistics worksheet, 8th graders solve and complete 2 multiple choice problems that include determining statistics. First, they determine the equation that best represents the data shown on the scatterplot. Then, students use...
Curated OER
Data Analysis
In these analyzing data worksheets, learners complete a table and a pie chart and calculate mean, median, mode, and range for sets of data.
Curated OER
Representing Data 1: Using Frequency Graphs
Here is a lesson that focuses on the use of frequency graphs to identify a range of measures and makes sense of data in a real-world context as well as constructing frequency graphs given information about the mean, median, and range of...
Wilderness Classroom
Pollution
Educate scholars on pollution—air, water, and land—with a series of lessons that begin with a thorough explanation of each type. Learners then take part in three activities to reinforce the importance of reducing pollution. They...
Curated OER
Representing Data 2: Using Box Plots
What information can be gleaned from a box and whiskers plot? Discuss the five summary values - minimum, maximum, upper and lower quartiles, and median - and what conclusions can be made from these values? Included here is a matching...
Moorea Coral Reef Long-Term Ecological Research Program
Paper Plate Fishes
Tropical fish make great art projects! Use paper plates to design, color, and assemble round and oval-shaped fish based on photographs of actual fish found along the Moorea Coral Reef. Kids learn about different fins- including the...
Math Learning Center
Fifth Grade Assessments and Scoring Checklists, Common Core State Standards
Check for understanding with a set of math assessments. Fifth graders answer questions involving multiplication and division, median and mode, rotational symmetry, and graphing.
Illustrative Mathematics
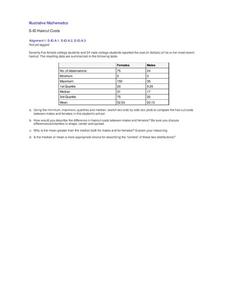
Haircut Costs
Who pays more for haircuts, men or women? Given quartile values, learners construct box and whiskers plots and interpret the results. They compare the mean and median, and discuss which is more appropriate under particular conditions....
Other popular searches
- Mean, Median, Mode
- Mean Median Mode
- Graphing Mean, Median, Mode
- Free Mean, Median, Mode
- Math; Mean, Median, Mode
- Mean Median Mode Range
- Mean, Median, Mode Range
- Mean Median and Mode
- Mathematics Mode and Median
- Median and Mean Statistics
- Mean, Median, Mode, Range
- Mean Median


