Curated OER
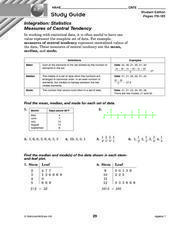
Integration: Statistics
In this math worksheet, students find the mean, median and mode for 6 number sets. Students then find the median and mode for data found in 2 stem-and-leaf plots.
Alabama Learning Exchange
The Mean, Median, and Mode Chain Gang
Students analyze a set of data. They work in cooperative groups and use chain links to identify the mean, median, and mode of the chain.
Curated OER
Global Warming Statistics
Students research and collect data regarding temperature changes for a specific location and find the mean, median, and mode for their data. In this climate change lesson, students choose a location to research and collect data regarding...
Curated OER
Mean, Median, and Mode
Students find the mean, median, and mode for a set of data. They define terms and find examples, as well as complete practice exercises. They work cooperatively to analyze real data from a variety of websites provided. To...
Curated OER
What Happened to the Mean and Median
Young scholars find the mean, median and mode. In hs statistics lesson plan, students collect, plot and analyze data. The identify the effect the central tendency have on the data and line.
Curated OER
The Statistics of Shoes
Learners open a blank spreadsheet and format it for a class survey about the number of shoes owned by the men and women in the class. They enter the data before finding the mean, median, mode, quartiles, variance, and the standard...
Curated OER
Mean Absolute Deviation in Dot Plots
The lesson focuses on the ideas of dot plot representations and the mean absolute deviation of data sets.
Pace University
Grades 7-8 Mean, Median, and Mode
Take a central look at data. The differentiated lesson provides activities for pupils to calculate central tendencies. Scholars begin choosing three central tendency activities from a Tic-Tac-Toe board. Learners then choose from sports,...
Curated OER
Measures of Central Tendency Using Scientific Calculators
Learners explore mean, median, and mode as they model mathematics in real-world problem situations. The lesson requires the use of the TI 30X IIS.
Curated OER
Drive the Data Derby
Three days of race car design and driving through the classroom while guessing probability could be a third graders dream. Learn to record car speed, distances traveled, and statistics by using calculation ranges using the mean, median,...
Curated OER
Raisin the Statistical Roof
Use a box of raisins to help introduce the concept of data analysis. Learners collect, analyze and display their data using a variety of methods. The included worksheet takes them through a step-by-step analysis process and graphing.
Curated OER
What Does Average Look Like?
Fifth graders explore the concepts of range, median, mode, and mean through the use of graphs drawn from models. They use manipulatives to represent data they have collected within their groups, and compare the differences between mode,...
Curated OER
Investigating Median, Mode, and Mean
Young scholars develop strategies to organize data while following teacher demonstration. They calculate the mean, median and mode of a data set while determining the relationships between the numbers. They analyze data from tables and...
Curated OER
What is the Average Height of Your Class?
In this statistics lesson plan, learners use an on-line form generator create a class-specific form, then complete the form, view a graph and data analysis, and draw conclusions.
Curated OER
U.S. Immigrant Statistics
Students compare the populations of ten U.S. states to the number of immigrants who entered those states in a given year and calculate the mean, mode, and median of the grouping. They discuss why some states are more attractive than...
Virginia Department of Education
Calculating Measures of Dispersion
Double the fun — calculate two measures of deviation. The lesson plan provides information to lead the class through the process of calculating the mean absolute deviation and the standard deviation of a data set. After learning how to...
EngageNY
Summarizing a Data Distribution by Describing Center, Variability, and Shape
Put those numbers to work by completing a statistical study! Pupils finish the last two steps in a statistical study by summarizing data with displays and numerical summaries. Individuals use the summaries to answer the statistical...
American Statistical Association
Tell it Like it is!
Scholars apply prior knowledge of statistics to write a conclusion. They summarize using correct academic language and tell the story of the data.
Curated OER
Exercise Those Statistics!
High schoolers participate in various activities, measuring their pulse rates and recording the data. They analyze the statistical concepts of mean, median, mode, and histograms using the data from the cardiovascular activities.
Curated OER
Candy Colors: Figuring the Mean, Median, and Mode
Students count candy by color and then calculate mean, median, and mode. They count candy and use the data to calculate mean, median, and mode (by color) and apply their learning to another collection of data.
Curated OER
Bringing Statistics Alive
Students compute mean, median and mode and compare mean, median and mode to a real-world application to identify their practical uses. They apply mean, median and mode to real-world statistical data. Finally, students organize data into...
Curated OER
Global Statistics
Students select appropriate data to determine the mean, median, mode and range of a set of data. They calculate the statistical data on literacy rates and life expectancy within each geographic region of the world. Students determine...
Curated OER
Finding Mean, Mode and Median in the Computer Lab
Students create spreadsheets which will display and figure mean, median, and mode of a set of numbers.
Curated OER
Mean, Median, and Mode
Students calculate measures of central tendency. in this mean, median, and mode instructional activity, students calculate the measures of central tendency. They organize data, examine and explain the statistics.


