Georgia Department of Education
Math Class
Young analysts use real (provided) data from a class's test scores to practice using statistical tools. Not only do learners calculate measures of center and spread (including mean, median, deviation, and IQ range), but...
Curated OER
Integration: Statistics
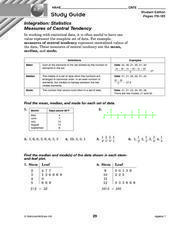
In this math worksheet, students find the mean, median and mode for 6 number sets. Students then find the median and mode for data found in 2 stem-and-leaf plots.
Curated OER
The Mean, the Median, and the Mode
In this statistics and probability worksheet, students analyze data to determine the mean, median, or mode as indicated for the given set of data. The four page worksheet contains a combination of twenty-five multiple choice and...
Curated OER
Statistics
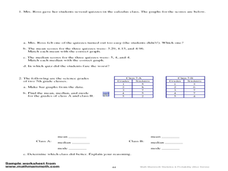
In this statistics instructional activity, 9th graders solve and complete 10 various types of multiple choice problems. First, they determine the mean number of miles per day that were completed. Then, students determine the data set...
Curated OER
Statistics
In this statistics worksheet, 9th graders solve and complete 10 various types of problems that include using different types of graphs to illustrate data. First, they determine the median score for each stem-and-leaf plot. Then, students...
Math Mammoth
Stem-and-Leaf Plots 3
In this stem-and-leaf instructional activity, students place statistical data in a stem-and-leaf plot. They identify the median, and range in a given set of data. There are four multi-step problems on this one-page instructional activity.
Curated OER
Statistics
In this statistics worksheet, 8th graders solve 4 problem sets related to an introduction to statistics. First, they find the range of each set of data. Then, students find the median and mode of each set of data. In addition, they...
Centre for Innovation in Mathematics Teaching
Ten Data Analysis Activities
This thirteen page data analysis instructional activity contains a number of interesting problems regarding statistics. The activities cover the concepts of average measurements, standard deviation, box and whisker plots, quartiles,...
Curriculum Corner
Measures of Central Tendency
Reinforce the concept of central tendency—mean, median, mode, and range—with a practice packet that comprises of eight problems and a structured answer sheet with plenty of room to show work.
Curated OER
Statistics
In this statistics instructional activity, 7th graders solve and complete 5 different problems related to determining various statistics. First, they find the average of a given set of numbers. Then, students find the median and mode of...
Curated OER
Family Size
In this family size worksheet, students complete a tally chart to determine data from a family size line plot. They organize the data in the chart to determine the mean, median, mode, and range of the data. There are six problems in...
Noyce Foundation
Baseball Players
Baseball is all about statistics. Pupils solve problems related to mean, median, and range. They calculate the total weight of players given the mean weight, calculate the mean weight of reserve players given the mean weight of the...
EngageNY
Summarizing a Data Distribution by Describing Center, Variability, and Shape
Put those numbers to work by completing a statistical study! Pupils finish the last two steps in a statistical study by summarizing data with displays and numerical summaries. Individuals use the summaries to answer the statistical...
Curated OER
Mean, Median, and Mode 1
For this mean, median and mode worksheet, learners use the measures of central tendency to describe given statistical data. Students identify the range of data, and match data to its representative bar graph. Two multi-step problems...
Curated OER
Statistics
In this statistics instructional activity, 9th graders solve and complete 8 different problems that include various measures of central tendency. First, they find the mean, median, and mode for each set of data. Then, students find the...
Curated OER
Means, Medians, and Modes
In this math worksheet, students find the mean, median, and mode for each set of numbers. Then they apply the methods to the word problems.
Curated OER
Midterm 1 Exam: Statistics
In this statistics instructional activity, students determine the mean, variance, standard deviation and median of given statistical data. They organize data, create box-and-whisker plots and identify outliers. This nine-page...
Curated OER
Using mean, median, and mode
In this mean, median, and mode activity, students read how to use each method and then complete problems using each one. Students complete 8 problems.
Curated OER
Probability and Statistics
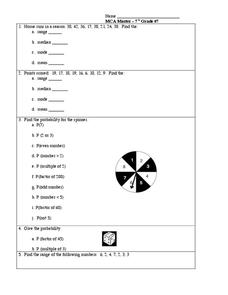
In this probability and statistics worksheet, students complete 5 problems regarding range, mean, median, mode, and a spinner probability problem.
Curated OER
Probability and Statistics - Week 10
For this probability and statistics worksheet, students find compound dependent and independent probability of given situations. They identify the mean, mode, range and median of sets. This two-page worksheet contains explanations,...
Curated OER
Measures of Center
In this statistics worksheet, students find mean, median, and mode for 3 problems. They find the mean of summarized data in 2 problems.
Curated OER
Measures of Central Tendency
In this measures of central tendency learning exercise, learners find the mean, median, and mode of 9 problems given different data sets. Students then solve 2 word problems.
Statistics Education Web
Saga of Survival (Using Data about Donner Party to Illustrate Descriptive Statistics)
What did gender have to do with the survival rates of the Donner Party? Using comparative box plots, classes compare the ages of the survivors and nonsurvivors. Using the same method, individuals make conclusions about the...
Noyce Foundation
Through the Grapevine
Teach statistics by analyzing raisins. A thorough activity provides lesson resources for five levels to include all grades. Younger pupils work on counting and estimation, mid-level learners build on their understanding of the measures...


