Curated OER
Shut it Off!
Students identify the central tendencies. In this statistics lesson, students find the mean, median and mode of their collected data. They explain the effect of outliers on the data.
Curated OER
Finding Averages
Fifth graders explore the world of statistics by finding averages. In this math formula lesson, 5th graders define the terms mean, median and mode while discussing the differences. Students practice finding the different...
Curated OER
Measures of Central Tendency
Students analyze data using central tendencies. In this statistics lesson, students collect and analyze data using the mean, median and mode. They create a power point representing the different measures of central tendency.
Curated OER
Create Your Own Form
Learners gather and organize data using a mock census form, and determine mean, mode, range, and median for sets of data.
Curated OER
Infusing Equity Gender into the Classroom
Young scholars investigate if gender makes a difference in the classroom. For this statistics lesson, students collect data on whether equity by gender in the classroom makes young scholars more successful.
Curated OER
Heart Smart in a Heart Beat
As an introductory activity, young statisticians measure their heart rate at rest and after exercise and compute the mean and median, and create a box & whisker plot. This is followed by watching a video (that no longer seems...
Curated OER
Number in Statistics
Second graders add two and three digit numbers. They are taught how to calculate the mean and the midpoint. Students are shown how to calculate symmetrical set of numbers. They are shown a model adding the same to each increases the...
American Statistical Association
Bear Hugs
Scholars research arm span to determine who gives the best bear hugs. They use data from a national study to find the standard statistics for arm span. It includes mean, median, quartiles, spread, standard deviation, and more.
Virginia Department of Education
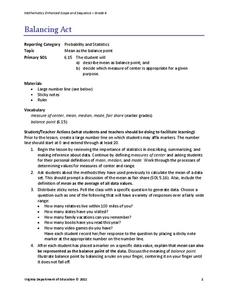
Balancing Act
How many different interpretations of the mean are there? Scholars place numbers on a number line and determine the mean. They interpret the mean as the average value and as the balance point.
American Statistical Association
An A-MAZE-ING Comparison
Teach your class how to use descriptive statistics through a hands-on data collection activity. Pupils collect their own data, calculate test statistics, and interpret the results in context. They compare male and female results, looking...
American Statistical Association
Colors Challenge!
Does writing the name of a color in a different colored ink affect one's ability to read it? Scholars design an experiment to answer this question. They collect the data, analyze the statistics, and draw a conclusion based on...
EngageNY
Connecting Graphical Representations and Numerical Summaries
Which graph belongs to which summary statistics? Class members build upon their knowledge of data displays and numerical summaries to connect the two. Pupils make connections between different graphical displays of the same data in...
Curated OER
Mean Meadian and Mode
Students apply central tendencies to given data. In this statistics lesson, students calculate the mean, median, and mode as it relates to their data. They collect data and graph it while identifying the way the numbers are ordered.
Curated OER
Global Warming Statistics
Young scholars research real-time and historic temperature data of U.S. and world locations, and analyze the data using mean, median, and mode averages. They graph the data and draw conclusions by analyzing the data. A spreadsheet is...
Curated OER
Statistics Newscast in Math Class
Students study sports teams, gather data about the teams, and create a newscast about their data. In this sports analysis lesson, students research two teams and define their statistical data. Students compare the two teams, make...
Curated OER
Bias in Statistics
Students work to develop surveys and collect data. They display the data using circle graphs, histograms, box and whisker plots, and scatter plots. Students use multimedia tools to develop a visual presentation to display their data.
Curated OER
Statistical Specimens
Third graders are introduced to statistical vocabulary. They complete an online activity that asks them to calculate the mean, median and mode for a set of data.
Curated OER
Collecting, organizing and comparing data for cellular telephone buying and calculating average, and median price and best deal per cost.
Students research data and develop statistical methods such as mean and median price and make convincing arguments as powerful ways for decision making.
Curated OER
Cruise Conditions Graphing & Statistics
Learners monitor weather conditions for an eighteen day period at a specific location. The temperature of both air and water is taken and the mean, median, and mode calculated. Differences between the highest and lowest recordings are made.
Curated OER
Averages: Computing Mean, Mode and Median
Seventh graders use daily temperature models to find the mean, mode and median.
Curated OER
Introduction to Descriptive Statistics
Learners follow examples to study basic concepts of statistics. They work independently through the activities.
Curated OER
Monitoring Math with a Statistical Spreadsheet
Learners use a spreadsheet to compute landmark statistics of a math
quiz. This lesson can be ongoing throughout the school year and it integrates mathematics curriculum and technology in a simple format for student use.
Curated OER
Statistically Lyrical
Students examine and discuss the writing of ratios as fractions and where they can be found in the real world. They complete worksheets and a questionnaire, and calculate the mean, median, and mode scores for the class.
Curated OER
Descriptive Statistics
Young scholars demonstrate how to use frequency and scatter diagrams. In this statistics lesson plan, students are introduced to different techniques of representing data. Young scholars sort and graph data on a worksheet and use a...


