Curated OER
Describing Data
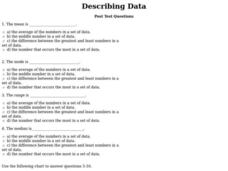
In this describing data worksheet, students answer multiple choice questions about mean, median, mode, and range. Students complete 10 questions total.
Curated OER
Temperature Bar Graph
Students explore mean, median and mode. In this math activity, students analyze temperature data and figure the mean, median, and mode of the data. Students graph the data in a bar graph.
Curated OER
Smarties Investigation
For this math worksheet, learners complete a variety of activities using Smarties candy. For example, students estimate the number of each color, count the actual amount, and record their results in a tally chart.
Curated OER
Global Statistics
Students determine statistics based on data. In this statistics lesson, students use data and record in charts. Students create graphs based on the statistics found.
Curated OER
Drive the Data Derby
Three days of race car design and driving through the classroom while guessing probability could be a third graders dream. Learn to record car speed, distances traveled, and statistics by using calculation ranges using the mean, median,...
Curated OER
Math: Giant Alaskan Cabbages
Students analyze data from the Alaska State Fair's "Giant Cabbage Weigh-Off." Once they have sorted the weights, they calculate the range, mean, mode, and median of the cabbages. Finally, students create posters displaying their...
Curated OER
Holly Leaves
Sixth graders analyze mathematics by participating in a botany activity. In this holly lesson plan, 6th graders identify if all holly leaves have the same amount of prickles by conducting a math survey. Students analyze many leaves and...
Inside Mathematics
Suzi's Company
The mean might not always be the best representation of the average. The assessment task has individuals determine the measures of center for the salaries of a company. They determine which of the three would be the best representation...
Curated OER
Interpreting and Displaying Sets of Data
Students explore the concept of interpreting data. For this interpreting data lesson, students make a line plot of themselves according to the number of cubes they can hold in their hand. Students create their own data to graph and...
Curated OER
Collecting Data and Graphing
Eighth graders, in groups, count the different colors of M&M's in each kind of package and then draw a pictograph to show the results. Each group writes a program to show their results and then compare the manually-drawn and computer...
Curated OER
Word Power
Fifth graders identify a set of data from a real world problem. In this statistics lesson, 5th graders identify the range, mode, median and mean using some manipulatives. They write words randomizing the letters.
Curated OER
What is a Box and Whisker Plot?
Eighth graders explore the correct use of box and whisker plors. The times when they are appropriate to use to compare data is covered. They plot data according to statistical analysis including mean, median, and mode.
Curated OER
Handling Data- Health Statistics
In this social studies worksheet, students organize 50 country cards into groups. Students analyze a chart and group countries according to lowest, middle, and highest Infant Mortality Rate.
Curated OER
Perplexing Patterns
Seventh graders identify and find missing patterns. For this algebra lesson, 7th graders investigate numbers and sequences and complete the pattern. They make a chart and discuss similarities and differences.
Curated OER
Using Averages to Create Graphs Through Excel
Sixth graders create and use a spreadsheet to make graphs which will be used to analyze Progress Report and Final Report Card grades. They practice finding the mean, median, mode, and range of a data set. Students also incorporate column...
Curated OER
Graph and Compare the Adventure's Temperature Vs. Local Temperature
Students explore the concept graphing data. In this graphing data lesson, students use weather data from their local weather and some other city and graph them. Students plot the local weather vs. another city. Students record...
Curated OER
We Are Having a Party! Part I
Second graders use data analysis skills in order to plan a class party. They graph possible times for the party noting the range for times. They discuss how mathematicians find and use the range to analyze data.
Curated OER
Timed Multiplication Test Graphs
Students use the tools of data analysis for managing information. They solve problems by generating, collecting, organizing, displaying histograms on bar graphs, circle graphs, line graphs, pictographs and charts. Students determine...
Curated OER
Words To Numbers
Seventh graders explore the four steps to problem solving. After observing a problem solving chart and discussing each step, 7th graders solve individually assigned word problems. Upon completion, they share their information with the...
Curated OER
Closing the Salary Gap
Young scholars explore careers in their community and compare the average salaries for men and women working in those careers. They explore a variety of careers available in their community through participating in this lesson.
Curated OER
Heartbeat Project
High schoolers enter information about their heartbeats into a spreadsheet. They construct data displays and calculate statistics. They describe and justify their conclusions from the data collected.
Alabama Learning Exchange
I Know What You Did Last Summer: A Data Graphing Project
Young scholars participate in graphing data. For this graphing data lesson, students make a stem and leaf plot of their summer activities. Young scholars create numerous graphs on poster boards. Students discuss the...
Curated OER
Beary O'Mometer Learns About Careers In Meteorology
Students explore the field of meteorology. In this meteorology lesson, students explore weather-related careers as they research the field of study as well as various weather concepts. Students interview meteorologists, write business...
Curated OER
Exquisite Excursions
Students locate 6 cities, one on each of the 6 major continents. They find distance for each leg of their journey, convert to percents, use a time zone map, and convert to foreign currencies.


