Curated OER
Mean, Median, Mode and Range Sheets
In this math activity, students use the graphic organizer to display their answers when learning about measures of central tendency. There are 4 boxes: mean, median, mode and range.
Curated OER
Guess-timating Fun
Learners estimate the number of items in a jar and write their estimate boldly on a piece of paper. They line up holding their numbers. Then, they calculate the median, mean, mode and average of the guesses.
Curated OER
Data Analysis
Young statisticians use and interpret measures of center and spread such as mean, median, and mode as well as range. They use box plots to represent their data and answer questions regarding the correspondence between data sets and the...
American Statistical Association
Who Has the Longest First Name?
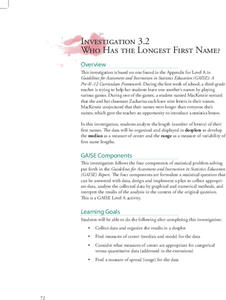
Name that statistic! Classmates each write their name and the number of letters in it on a sticky note to place on the board. As a class, they determine the median, mode, and range of the name lengths, and create a dot plot of the data....
Curated OER
Shedding Light on the Weather with Relative Humidity
Learners study weather using a graphing calculator in this instructional activity. They collect data for temperature and relative humidity for every hour over a day from the newspaper, then place the data in their handheld calculator and...
Curated OER
Find the Range #1
In this mean, median, mode, and range worksheet, students find the mean, median, mode, and range of a group of one digit numbers with numbers up to 9. Students complete 6 problems total.
Curated OER
Range, Mean, Median and Mode
In this finding range worksheet, students find mean, median, mode and range for 6 sets of numbers.
Curated OER
Mean, Median, Mode, and Range: Practice
In this line plots worksheet, learners make a line plot for each set of data and identify any clusters or gaps. Students then find the mean, median, mode, and range for the first four problems. Learners then find n using the given mean,...
Curated OER
Beyond Averages: Median, Mode and Range: Post Test
In this data learning exercise, students complete a 10 question multiple choice post test about finding the median, mean, mode and range of a set of data.
Curated OER
Mathematical Modeling
Study various types of mathematical models in this math lesson plan. Learners calculate the slope to determine the risk in a situation described. They respond to a number of questions and analyze their statistical data. Then, they...
National Security Agency
Are You Ready to Call the Guinness Book of Records?
Learners design questions that can be answered by collecting data. For this line-plot lesson, pupils collect data and graph on a line plot on world records. An abundant supply of teacher support is provided in this resource.
Curated OER
Dynamic Data Range, Mode, Median, and Mean
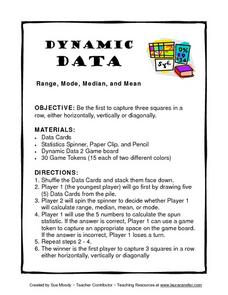
In this lesson plan, Dynamic Data Range, Mode, Median, and Mean, students play a game while figuring range, mode, median, and mean. Students spin for their task, figure the mode, mean, median or range of a row of numbers and gain a space...
Curated OER
Ranging the Triple M's
Fifth graders explore collecting and analyzing data. In this mean, median and mode instructional activity, 5th graders use real word data to determine the mean, median and mode. Students are given sets of numbers on index cards as asked...
Curated OER
Determining Mean, Range, Median, Mode, and Probability
Students calculate mean, median, range, mode and probability. Then, working in teams, they use data from their workplace to compute values for these terms. Finally the class explores the term "probability" using a die.
Curated OER
Range, Mean, Median and Mode Through the Internet
Students compute measures of central tendency. For this range, mean, median and mode lesson, students gather information on the internet, organize the data and then compute the measures of central tendency. They create a persentation...
Curated OER
How Big Is Your Head?
Students explore measurement by measuring classmates' heads. They record their measurements and they put the measurements in order from smallest to largest. Students figure the mean, median, mode, maximum, minimum, and range of their...
Curated OER
Probability and Statistics
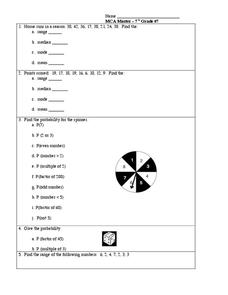
In this probability and statistics instructional activity, students complete 5 problems regarding range, mean, median, mode, and a spinner probability problem.
Curated OER
Measures of Central Tendencies: Quartiles
In this statistics worksheet, students calculate the mean, median, mode, range, lower quartile, and upper quartile for 10 questions and interpret a box and whiskers graph.
Curated OER
How Alike Are We?
Fourth graders find the range, mode, median, and mean for each of the data sets (height and shoe size). They discuss which measure of central tendency for each data set best represents the class and why. Students graph the shoe size and...
Curated OER
What's Your Average? What Do You Mean? I'm More Than Just Average
Upper grade and middle schoolers collect data, analyze and interpret the data. This three-part activity should provide learners with a firm understanding about the differences between mean, median, and mode and how to perform the...
Curated OER
Making Informed Decisions Using Measures of Central Tendency
Students calculate the mean, median, mode, range, and interquartile range for a set of data. They create a box and whisker plot using paper and pencil and technology and determine which measure of central tendency is the most helpful in...
Curated OER
Introduction to Measures of Central Tendency and Variability
Students calculate the mean, median, mode, range, and interquartile range for a set of data. They create a box and whisker plot using paper, pencil and technology.
Curated OER
What Does Average Look Like?
Fifth graders explore the concepts of range, median, mode, and mean through the use of graphs drawn from models. They use manipulatives to represent data they have collected within their groups, and compare the differences between mode,...
Curated OER
Not Your Average Planet
Fourth graders explore median, mode, mean, and range using information about the planets and our solar system.
Other popular searches
- Mean Median Mode Range
- Mean, Median, Mode Range
- Mean, Median, Mode, Range
- Mean Median Mode and Range
- Range, Mean, Median, Mode
- Mean, Median, Mode, and Range
- Mode Median Range
- Mean, Median, Mode and Range
- Statistics Median Mode Range


