Curated OER
Data Analysis, Probability, and Discrete Math: Lesson 5
Eighth graders are read the material that is printed in boldface type inside the boxes. Information in regular type inside the boxes and all information outside the boxes should not be read to them. They then find the mean, median,...
Curated OER
Button Bonanza
Collections of data represented in stem and leaf plots are organized by young statisticians as they embark some math engaging activities.
Mathed Up!
Stem and Leaf Diagrams
Order the data within a stem-and-leaf display. Pupils take data and create and ordered stem-and-leaf diagrams, including the key. Participants take their data and determine answers about the information. Class members then find measures...
Math Moves U
Collecting and Working with Data
Add to your collection of math resources with this extensive series of data analysis worksheets. Whether your teaching how to use frequency tables and tally charts to collect and organize data, or introducing young mathematicians to pie...
Noyce Foundation
Through the Grapevine
Teach statistics by analyzing raisins. A thorough activity provides lesson resources for five levels to include all grades. Younger pupils work on counting and estimation, mid-level learners build on their understanding of the measures...
Rice University
Introductory Statistics
Statistically speaking, the content covers several grades. Featuring all of the statistics typically covered in a college-level Statistics course, the expansive content spans from sixth grade on up to high school. Material comes from a...
National Museum of Mathematics
Hands-On Data Analysis
Jump at the chance to use this resource. A kinesthetic activity has classmates jumping in several different ways (standing, single-step, and multiple-step jumps) to create handprints on poster paper taped to the wall. They measure the...
Curated OER
Global Statistics
Students determine statistics based on data. In this statistics lesson, students use data and record in charts. Students create graphs based on the statistics found.
Curated OER
Lessons for Atlatl Users with Some Experience-Grade 6
Sixth graders experiment with an atlatl and dart. In this sixth grade data management mathematics lesson, 6th graders explore and determine the most suitable methods of displaying data collected from their experimentation with throwing...
Curated OER
Collecting Data and Graphing
Eighth graders, in groups, count the different colors of M&M's in each kind of package and then draw a pictograph to show the results. Each group writes a program to show their results and then compare the manually-drawn and computer...
Math Guy
Algebra 1 Practice Final
What makes this resource special? The amazing answer key that comes with worked out solutions and notes for each problem. Practice problems include all topics ranging from linear systems to simplifying exponential expressions. The packet...
Curated OER
Tech Algebra: A Statistics Study
Young scholars use the internet to gather a minimum of thirty pieces of data. Students create box and whisker graphs, and stem and leaf plots from the information. They calculate mean, median, mode, and range. Young scholars write a...
Curated OER
Representing Data 1: Using Frequency Graphs
Here is a lesson plan that focuses on the use of frequency graphs to identify a range of measures and makes sense of data in a real-world context as well as constructing frequency graphs given information about the mean, median, and...
Polar Trec
How Much Data is Enough?
The next time you read a magazine or watch the news, make note of how many graphs you see because they are everywhere! Here, scholars collect, enter, and graph data using computers. The graphs are then analyzed to aid in discussion of...
Curated OER
Quiz: Central Tendency and Dispersion
In this central tendency and dispersion worksheet, students find the mean, median and mode of a set of numbers. The set of numbers is not included on this worksheet. They complete a frequency distribution and find the modal interval.
Curated OER
Capture/Recapture
Students use proportions to estimate the size of populations. They describe the data with using a graph or table of the estimate. Students use descriptive statistics to calculate mean, median, and mode. They also compare and contrast an...
Curated OER
Mean, Mode, Range, Median
In this weather worksheet, students look at the average monthly temperatures and precipitation for their own city to determine the mean, mode, range, and median. This worksheet has 8 fill in the blank questions.
Curated OER
Stem and Leaf Plots
In this measures of central tendency worksheet, students study a stem and leaf plot pertaining to weekly low temperatures. Students use the plot to answer 6 questions. There will be a question that requires students to make their own...
Curated OER
Measures of Central Tendency
Students analyze data using central tendencies. In this statistics lesson, students collect and analyze data using the mean, median and mode. They create a power point representing the different measures of central tendency.
Curated OER
Record 'The' Results
Third graders predict how many times they'll see the word "the" in a newspaper page and highlight all the "the"s they find. After reviewing definitions of range, median, mode, mean they create a Stem and Leaf Plot and a Back-to-Back Stem...
Curated OER
Twenty Questions: Fourth Grade Math Terms
Questions related to math vocabulary from a large variety of categories for 4th graders are displayed throughout this Jeopardy game. Concepts covered include angles, shapes, computation terms, statistics, and place value.
Curated OER
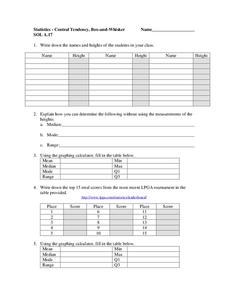
Central Tendency
For this central tendency worksheet, students solve and complete 10 different problems that include measures of central tendency. First, they write down the names and heights of students in their class. Then, students explain how they...
Los Angeles County Office of Education
Assessment For The California Mathematics Standards Grade 6
Test your scholars' knowledge of a multitude of concepts with an assessment aligned to the California math standards. Using the exam, class members show what they know about the four operations, positive and negative numbers, statistics...
Willow Tree
Box-and-Whisker Plots
Whiskers are not just for cats! Pupils create box-and-whisker plots from given data sets. They analyze the data using the graphs as their guide.
Other popular searches
- Mean Median Mode Range
- Mean, Median, Mode Range
- Mean, Median, Mode, Range
- Mean Median Mode and Range
- Range, Mean, Median, Mode
- Mean, Median, Mode, and Range
- Mode Median Range
- Mean, Median, Mode and Range
- Statistics Median Mode Range


