Curated OER
Quadratic Equations and Parabolas
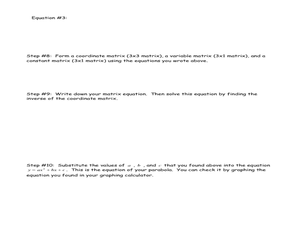
Learners graph and solve quadratic equations. In this functions lesson plan, students analyze a quadratic equation using three points on a curve to define the graph of a quadratic function. They find the vertex and intercepts of the graph.
Curated OER
Tic-Tac-Toe
Young scholars investigate finite mathematics using a flow chart. In this algebra lesson, students investigate logic and strategies using flowcharts. Young scholars compete against each other using different approaches to playing the game.
Curated OER
Picking Chips: Experimental Probability
Students apply the concepts of an event occurring to playing a game. In this probability instructional activity,students differentiate between experimental and theoretical probability.
Curated OER
Real Misleading Graphs
Students identify real graphs and misleading graphs. For this algebra lesson, students surf the Internet for real life scenarios where graphs are used in a misleading way as well as in a correct way.
Curated OER
Monopoly Graphs
Students relate the concepts of linear functions to the game of monopoly. For this algebra lesson, students solve problems with ratio and proportion. They collect data and graph it.
Curated OER
The Monty Hall Problem
Young scholars define and differentiate between experimental and theoretical probability. In this statistic lesson, students play the game "Monty Hall" and use probability to come up with the best strategies to play the game.
Curated OER
Number Line Relay
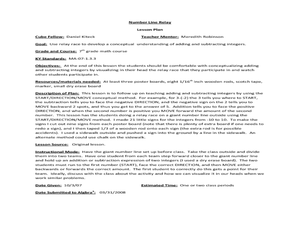
Students investigate the placements of numbers on a number line. In this algebra instructional activity, students visualise addition and subtraction on a number line.
Curated OER
Polly and the Shapeshifter
Students analyze the patterns in polygons and relate it to the rate of change. In this algebra lesson, students discuss the relationship between the data and the graph of the data.
Curated OER
TI Math, Games
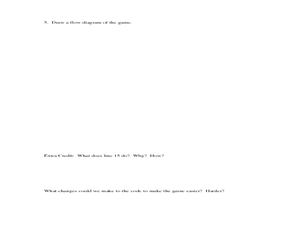
Students solve problems using technology. In this algebra lesson, students apply flow diagrams and computer codes to solve problems. They use the TI to view the graphs.
Curated OER
Using Ratios to Taste the Rainbow
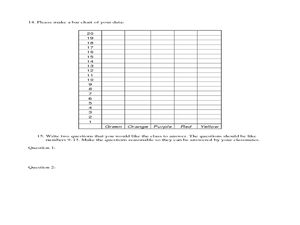
Students solve problems using ratios and proportion. In this algebra lesson, students analyze skittles and their different colors as they apply the properties of ratios and proportions to solve their problems.
Curated OER
Triangle Wars
Students explore geometry by participating in a class card game. In this triangle lesson, students utilize playing cards with shapes on them which they group up and discard, similar to "Old Maid." Students complete a worksheet and answer...
Curated OER
Juggling Slopes
Pupils identify the slope of a line. In this algebra lesson, students label slopes as positive, negative, zero or undefined. They use the slope formula to find the slope algebraically and graphically.
Curated OER
An Introduction to Measuring Theory
Students investigate one, two and three dimensional objects. In this algebra lesson, students differentiate between different shapes of objects and write equations to represent each. They start with what they already know and prove...
Curated OER
JFK Assassination
Learners write equations of a line. In this algebra lesson, students investigate the assassination of JFK through linear equations. They calculate the length of given line segments.
Curated OER
Origami Cube
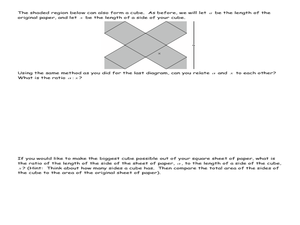
Pupils compare two lengths using the area of a square. In this geometry lesson, students solve problems using ratio and proportion of the two shapes. They solve equations by taking the square root of both sides.
Curated OER
Application of the Pythagorean Theorem
Students find the length of the hypotenuse using the Pythagorean Theorem. In this geometry lesson, students solve for the different parts of a right triangle. They work the first problem with-the teacher then work on their own.
Curated OER
An Introduction to Counting
Young scholars define the counting principle and how it relates to integers. In this algebra lesson, students add and subtract using the addition and multiplication principles. They solve problems using combination and permutations.
Curated OER
Analyzing Graphs and Data
Students collect and analyze data. In this statistics instructional activity, students graph their data and make inferences from the collected data. They display their data using graphs, bar graphs, circles graphs and Venn diagrams.
Curated OER
An Application of Congruence
Young scholars solve triangles using the properties if congruency. In this geometry lesson, students apply congruent and similar figures to solve real world and math problems. They show they are able to follow instructions.


