Curated OER
Paper Planes
In this unit, 3rd graders investigate one variable to see if they can make a paper plane fly farther. They use scatter plots to establish a possible relationship between variables then use what they have found to make a paper plane to...
Curated OER
Time Zones
Students are able to read and also use a variety of timetables and charts. They perform calculations with time, including 24-hour clock times and time zones. These are very important concepts that Students probably have to bear in mind...
Curated OER
Cool Times with Heat
Students work with thermometers to complete problems about temperature. They investigate cooling patterns, how location affects temperature, and what happens when water having different temperature is mixed. They measure temperature in...
Curated OER
Paper Gliders
Sixth graders study friction and drag. In this science lesson, 6th graders use different models of gliders and test to see which of the gliders fly the farthest. Students analyze their data and construct a graph.
Curated OER
La Toteca- A Tropical Paradise
Students collect data on the time of the ferry. In this algebra lesson, students use the data to predict a ferry schedule. They also compute the depth where oxygen would be needed when diving.
Curated OER
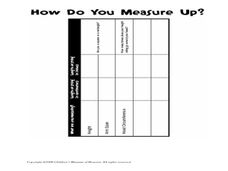
How Do You Measure Up?
Students measure their body. In this measurement lesson, students use a string to measure their height and the circumference of their head. They record this information on the worksheet provided and answer questions as a group.
Curated OER
Maps and Modes, Finding a Mean Home on the Range
Fifth graders investigate data from maps to solve problems. In this data lesson, 5th graders study maps and collect data from each map. Students present their data in a variety of ways and calculate the mode, mean, median, and range.
Alabama Learning Exchange
Effects of Friction on a Moving Block
Students investigate how friction affects the movement of a block across surface areas. They test five different kinds of surfaces—smooth surface, wax paper, a paper towel, course, and fine sandpaper. They predict and record the results...
Curated OER
An Introduction to Chemistry
In this chemistry instructional activity, students solve 47 problems involving measurement conversions from one unit to another. They explain how values should be reported from measurements.
Curated OER
Relationships and Functions
Fifth graders describe patterns as relations and functions. In this patterning lesson plan, 5th graders analyze and continue patterns. Students understand how patterns relate to relations and functions.
Curated OER
How Hot Is It?
Fourth graders practice estimating temperatures. They practice in Celsius and Fahrenheit.
Curated OER
A Real Difference
Fifth graders use the Celsius and Fahrenheit thermometers to compare temperature readings. They use the Internet to find the temperatures of selected cities. After data is collected for five days, 5th graders graph the temperatures.
Curated OER
Average Looking
Students use measurements of their classmates to find the average (means and modes) of their facial features. They use their findings to create a three-dimensional "class head." Examples and assessment materials are included.
Curated OER
Triangle Explorer
Students compute the area of triangles in a computer program. In this measurement lesson plan, students complete 5 easy, 5 medium, and 5 hard problems.
Curated OER
Graphing Your Motion-Day 1
Ninth graders explore the concepts of motion, velocity and acceleration through graphing their own movement using LoggerPro. They become more familiar with the computer technology. Students explore graphing in real time and graph on...
Curated OER
Black Bayou Lake Measures Up
Students, in groups, estimate measurments and then select the tools needed and measure various items at Black Bayou Lake refuge.
Curated OER
How far is a km?
Young scholars explore the size of a kilometer and the time it takes to cover this distance. They develop a concept of a km. They measure a distance of 1 km and the time taken to cover it.
Curated OER
Byah Word Search Puzzle
For this literacy worksheet, learners find the words that are related to the concept that is the theme of the word search puzzle.
Curated OER
BYAH Word Search Puzzle
In this math activity, students look for the words in the puzzle that are related to the theme of measurement. Spelling skills are worked on.
Curated OER
Home on the Range
Students use maps and mathematics to determine the appropriate panther population in a given area. In this Florida ecology lesson, students research the area requirements of male and female panther and use a map to help calculate how...
Curated OER
Using Multiplication to Solve Word Problems
Students explore math functions by solving word problems in class. In this multiplication lesson, students utilize colored cubes and base blocks to visualize multiplication problems. Students identify the multiplication values within...
Curated OER
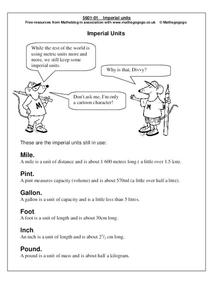
Imperial Units
In this imperial units worksheet, learners read the definitions to the following list of imperial units: mile, pint, gallon, foot, inch and pound.
Curated OER
Snow Cover By Latitude
Students examine computerized data maps in order to create graphs of the amount of snowfall found at certain latitudes by date. Then they compare the graphs and the data they represent. Students present an analysis of the graphs.


