Curated OER
Let's Go To Mexico
Students are able to use the Internet to conduct research. They research Mexican culture and traditions. Students compare and contrast Mexican and U.S. food and clothing. They convert United States currency to Mexican pesos. Students...
Curated OER
A Tough Nut to Crack
Sixth graders explore agriculture by examining world geography. In this pecan cultivation lesson, 6th graders identify the history of the famous nut and the impact it has on the U.S. economy, diet and human body. Students define...
Curated OER
Discovering New Mexico
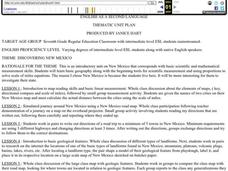
Seventh graders discuss the elements of maps and using basic linear measurement. They calculate the distance between the cities and create a simulated journey around New Mexico using a road map. They write out the directions for their...
Curated OER
Traveling Through Literature
Integrate geography with literature in this interdisciplinary lesson. Begin by reading a poem such as The Time We Climbed Snake Mountain by Leslie Marmon Silko. On a large map, place push pins in the cities or states mentioned. An...
Curated OER
A Tough Nut to Crack
Children, based on a set of criteria, evaluate the quality of pecans. They research recorded history of pecan trees as well as how their seeds moved across western Missouri into southeastern Kansas, Oklahoma, Texas and Mexico. In...
Curated OER
What Happens When Sea Level Rises or Falls
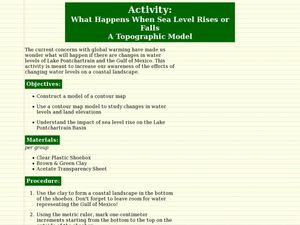
Students examine the impact of sea level on land formations. In this geography and map lesson plan, students construct a contour map model illustrating how much of the clay "coastline" is covered as water is added. Metric measurement...
Concord Consortium
Look High and Low
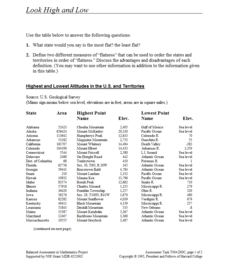
From the highest high to the lowest low here's a resource that won't fall flat. Given data on the area and the highest and lowest elevations of each of the 50 states, learners decide which states are the least flat and the most flat. Of...
Curated OER
In the Wake of Columbus
Students explore how the population decreased in native cultures.
Curated OER
Where in the World Do Those Cookies Come From?
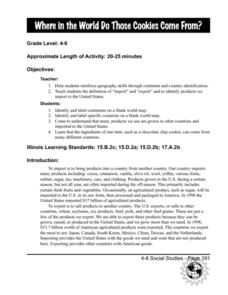
Students discuss exports and imports by discovering where the ingredients come from for making chocolate chip cookies. They take a survey of their favorite cookies and create a bar graph to represent the information.
Curated OER
Corn Exports Visually
Young scholars study imports and exports and the countries that import the most corn from the U.S. They construct mini paper corn plants and label a map with these plants to represent the amount of corn the U.S. exports to countries...
Curated OER
Use a Bar Graph
In this bar graph worksheet, students use a given bar graph to answer a set of 3 questions. Answers included on page 2.A reference web site is given for additional activities.
Other popular searches
- New Mexico Geography
- Geography of Mexico
- Mexico Geography Map
- Geography Mexico
- Cultural Geography of Mexico
- The Geography of Mexico
- Physical Geography of Mexico
- Teaching Geography of Mexico
- Making Physical Maps Mexico


