Curated OER
Mixed Table Grid 3
For this multiplication worksheet, students solve 150 problems providing the correct computations illustrating their understanding of multiplying numbers from 1 to 10.
Curated OER
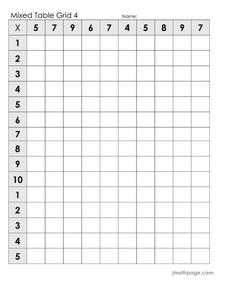
Mixed Table Grid 4
In this multiplication worksheet, students fill in a multiplication grid by multiplying numbers 1 to 10. There are 150 problems to solve.
Curated OER
Wetlands Mammals Facts Table
In this mammals worksheet, students complete this graphic organizer about different mammals in the Wetlands. Students complete 40 boxes in the graphic organizer.
Curated OER
Charting the Discovery of the Americas
Students create chart using Microsoft Word depicting how trade led to the exploration of different regions of the world.
Curated OER
Colorful Fractions
Young scholars use charts to show fractions. In this fractions and percents lesson, students review fractions, percents and ratios. Young scholars create tables and color the cells to make different fractions. Students answer...
Curated OER
Handling Data
Students create a simple table in order to solve a problem. As a class, they create a simple data table in order to discover the number of letters in each student's name. This data is interpreted in order to answer questions and make...
Curated OER
Pond Theme Unit
For this pond theme worksheet students research facts on pond life. Students complete comprehension questions, crosswords, word search, and math puzzles. Students write a short report.
Curated OER
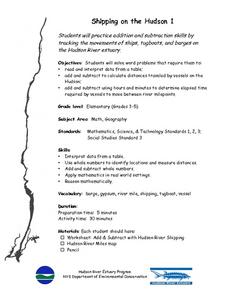
Shipping on the Hudson
Students track movements of ships, tugboats, and barges on the Hudson River estuary in order to practice addition and subtraction skills. They solve word problems by reading and interpreting data from a table. They calculate distances...
Curated OER
Get On Board
Students create a ticket table illustrating the cost of tickets by alternative transportation. In this number sense lesson, students write number sentences to compare and contrast difference information in their chart. Students figure...
Curated OER
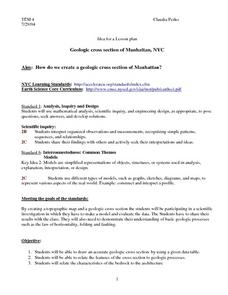
Geologic cross section of Manhattan, NYC
Students draw an accurate geologic cross section by using a given data table. They relate the features of the cross section to geologic processes. Students then relate the characteristics of the bedrock to the architecture.
Curated OER
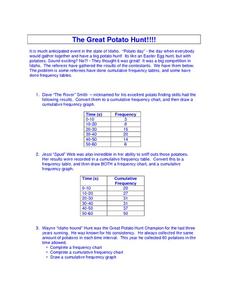
The Great Potato Hunt
In this science worksheet, students examine the data from the potato hunt where potatoes are found like Easter Eggs. The data of the number of potatoes found is recorded in the frequency tables.
Curated OER
Locating the Salt Front - Section 1
For this salt front of the Hudson River worksheet, 7th graders first read an excerpt about the lower portion of the Hudson River that is an estuary. Then they use a colored pencil to plot salinity data from the table shown on a graph,...
Curated OER
Interpreting a Pictogram
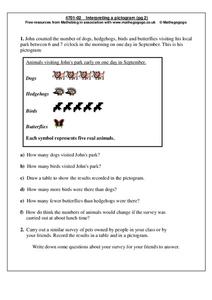
In this pictogram worksheet, students read and analyze a pictogram about dogs, hedgehogs, birds and butterflies and then answer 6 short answer questions. Students conduct a similar survey on pets owned by their friends and put their...
Curated OER
Linear Equations
In this linear equations activity, 9th graders solve and complete 7 different problems that include a number of linear equations. First, they determine the slope given the points and then write an equation in slope-intercept form. Then,...
Curated OER
Goldilocks and the Library Media Center
Third graders explore the library media center using the characters and story of "Goldilocks and the Three Bears" by James Marshall. They discuss what rules Goldilocks would need to follow in the library, complete a sequence chain for...
Curated OER
Live And Let Die?
In this live and let die activity, students, with a partner, complete a verb tense table on the verb die, fill in nine sentences with nine phrases associated with death and discuss ten questions dealing with suicide and crimes.
Curated OER
Weather Data Analysis
In this weather worksheet, students read a data table comparing the temperature and weather conditions at three different locations. Students use this data to complete 8 fill in the blank, 1 short answer question, and one graph.
Curated OER
Water Equilibria
For this water equilibria worksheet, students calculate the pH of solutions, they fill in a table with the type of acid or base given a compound and it's concentration and they calculate approximate solubilities for salts.
Curated OER
Prism Investigation (2)
In this prism investigation worksheet, students identify the patterns and complete the table of shapes for triangular prisms, cuboid prisms, and hexagonal prisms. Students write eight short answers.
Curated OER
Prism Investigation (3)
In this prism investigation worksheet, students complete a table telling the shapes at the end of prisms, the number of sides at each end, and the number of edges and complete the pattern of a function machine. Students write eight answers.
Curated OER
Relations and Functions
Students differentiate between a relation and a function. In this algebra lesson plan, students identify a pair of coordinates as being a relation or a function. They analyze graphs for function as they solve word problems.
Curated OER
Beginning Synonyms and Antonyms-Multiple Choice-Nouns
In this synonym/antonym worksheet using nouns, learners are given one set of nouns and select the best synonym for each word. Next, students repeat the activity with a new set of words, selecting the best antonym.
Curated OER
Poetic Math Greeting Cards
Fourth graders work in groups; collect data in a survey; depict in tables, charts, or graphs the results of the survey; and make predictions. They use creative writing skills and computer skills to generate a greeting card of their own.
Curated OER
What Makes a Habitable Planet?
Students list conditions necessary for humans to survive. They then mix yeast with a nutrient broth consisting of warm water and table sugar in a plastic bottle, capping it with a party balloon and compare the factors within the bottle...


