Utah Education Network (UEN)
Probability and Statistics
MAD about statistics? In the seventh chapter of an eight-part seventh-grade workbook series, learners develop probability models and use statistics to draw inferences. In addition, learners play games and conduct experiments to determine...
University of Utah
Geometry Part 2: Measurement in 2- and 3-Dimensions, Plane Sections of Solids
What kind of tree does a math teacher climb? A geometry! Here is a lesson that includes all the geometry resources you could ever wish for in one comprehensive workbook. Class members demonstrate what they have learned by determining the...
West Contra Costa Unified School District
Key Features of Graphs
The key is ... After a day of instruction on key features of graphs, groups create a poster and presentation on the key features of their given function graph. The resource provides an extension activity of "telephone" using graphs.
Inside Mathematics
Population
Population density, it is not all that it is plotted to be. Pupils analyze a scatter plot of population versus area for some of the states in the US. The class members respond to eight questions about the graph, specific points and...
Read Works
How to Say “I Ruff You”
Who says you need a human to be your valentine on Valentine's Day? Give your dog-loving readers an inspiring perspective on how a sister givdes her brother a valentine from the family dog. They then answer 10 questions thatd involve...
Yummy Math
Should NFL Quarterbacks Shave or Grow a Beard?
What does facial hair have to do with quarterback ratings? Using a set of data that provides QBR with and without facial hair, football enthusiasts determine if performance is affected. It also has learners question if the relationship...
Yummy Math
Deflate-gate
Does temperature affect the air pressure of a football? Young mathematicians look at the readings from a pressure gauge and determine if the balls are within regulation or are under inflated.
University of Georgia
Freezing and Melting of Water
Examine the behavior of energy as water freezes and melts. An engaging activity provides a hands-on experience to learners. Collaborative groups collect data and analyze the graphs of the temperature of water as it freezes and then...
Curated OER
Multiplication Rule: Complements and Conditional Probability
In this probability worksheet, students read story problems and set up complement and conditional probability problems according to the multiplication rule. Three story problems are included on this worksheet.
Curated OER
Atomic Mass of Candium
By focusing on "Candium", pupils can work through this guide to learn more about different isotopes. The teacher will supply M&M's, Skittles and Reeses Pieces to provide data about mass and abundance.
Curated OER
Applying SQ3R to Texts
After a review of the SQ3R strategy, readers use the provided prompts to respond to a text. The value of this worksheet is in the additional questions that move the learner into higher levels of reasoning.
Curated OER
Feasibility Study For a New Business
In this business worksheet, students write out a research study looking at the potential for a new business or the profits of an existing one.
Curated OER
Domain and Range
In this domain and range instructional activity, students write the definitions for relation, function, domain and range. They then find the domain and range of 7 sets of ordered pairs. Finally, students answer 4 questions regarding...
Curated OER
Advanced Grammar 1-- Tenses and Time Expressions
Quiz your class using this short assessment tool. English language learners (or native speakers reviewing verb conjugation) fill in 16 blanks to complete various sentences. The way this quiz is designed, each question is worth 6.6 points.
Curated OER
Tenses and Time Expressions
Now that your class has worked to understand verb tenses and time expressions, assess them on their understanding and application. Seven questions are provided here; for each, English language learners (or young native speakers) must...
Curated OER
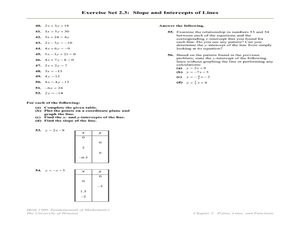
Slope, Intercepts, and Graphing a Line
In this intercepts and slope worksheet, students find the slope and/or the x and y-intercepts in fifty-three problems. Students also graph lines using the x and y-intercepts.
Curated OER
Prepositions and Preposition Checkup
Polish preposition usage with this practical grammar reference sheet and exercise. This hand-out provides a brief breakdown of when to use the basic prepositions at, on, in and to as well as example sentences that include these basic...
Curated OER
Ready, Steady, Cook!
When paired with a trip to Aston Hall's kitchen, this activity is a good way to practice recall and descriptive language. Without literally being in the kitchen, it could actually be an even better activity! Students could use their...
Curated OER
Thanksgiving: Simple Present Tense Review
Learners read eight sentences and fill in the blanks with the correct simple present tense verb needed to complete it correctly. Thanksgiving theme could help out in those antsy days before the holiday break.
Curated OER
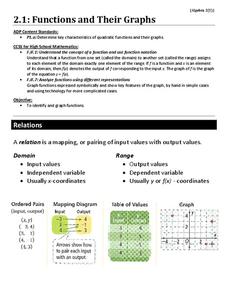
Functions and Their Graphs
Use a instructional activity to go over the basic concepts of relations and functions. Included are clear definitions and examples of relations, domain and range, and functions and the vertical line test. However, the problems are...
Curated OER
Addition Chart
In this addition chart worksheet, students fill in an addition chart that is partially filled in. Answers are included on page 2.
Curated OER
Demonstrative Pronouns
In this demonstrative pronouns worksheet, learners identify demonstrative pronouns in sentences. In this short answer and fill in the blank worksheet, students write fourteen answers.
Curated OER
Predator-Prey Simulation
In this predator-prey instructional activity, students simulate the relationship between predators and prey using small squares to represent rabbits and large squares to represent coyotes. They complete 20 rounds of the simulation trying...
Curated OER
Statistics - Central Tendency
In this statistics activity, students solve and complete 13 different problems that include creating various box-and-whisker plots. First, they write a definition for mean, median, mode and range. Then students explain how to determine...


