Curated OER
Burning Snacks in Chem Lab
Students determine the energy content of various snack foods. They measure the temperature changes in various snack foods as the foods are burned in order to determine the foods' energy content. Students create graphs and data tables of...
Curated OER
Getting Familiar with Fractals
Young scholars use the Internet to answer lab questions about fractals, and then construct fractals using the initial stage and iteration rule. They complete tables and generate rules for the "nth" term and create their own fractals.
Curated OER
Science All Around You
Students visit and explore a Hands On Science Center (HOSC). They participate in a variety of self-guided table exercises and observe as scientists demonstrate various scientific principles.
Curated OER
The Sun's habitable Zone
High schoolers explore the average surface temperature of planets. They use the Planet Temperature Calculator to find the average temperature. Students explore how the distance from the sun affects the Earth's average surface...
Curated OER
Gift Wrapping
Sixth graders use the example of a gift wrapping service found in the mall in order to create a problem situation that can be solved mathematically. They convert the word problem into algebraic expressions to be solved.
Curated OER
Rain Forest Birds
Fifth graders look at the levels of the rain forest. In this rain forest lesson, 5th graders choose a rain forest animal and explain which of the four levels of the rain forest they think that animal lives in. They also complete a word...
Curated OER
Using Charts and Graphs to Study East Asia's Modern Economy
Students examine East Asia's modern economy. In groups, classmates use the internet to compare the resources, products, and economy of specified countries. After collecting the data, pupils create charts, tables and graphs. They...
Curated OER
Is Dilution the Solution To Pollution?
Students demonstrate the meaning of dilution and concentration and how pollution can affect the water that you drink. They perform an experiment to calculate the final concentration and dilution factor of solutions. They record the color...
Curated OER
Ratios
Sixth graders investigate the concept of ratios and how they can be used to represent the comparison of quantities. The lesson is taught using a table or graph to compare two categories of data.
Curated OER
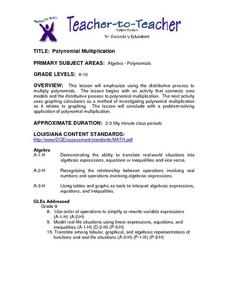
Polynomial Multiplication
Students review information about how to multiply polynomials and then work in pairs to complete a worksheet. They use graphing calculations to help them solve their math problems.
Curated OER
How Can We Keep Our Forests Intact and Have Our Chocolate Too?
Fourth graders explore various methods of growing and harvesting rainforest foods in order to sustain its biodiversity. They discuss the various uses for trees from several viewpoints. Students research chocolate demand and land use...
Curated OER
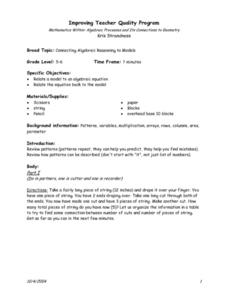
Connecting Algebraic Reasoning to Models
Young scholars analyze relating a model to an algebraic equation and visa versa. Patterns are reviewed in detail and then in pairs new models are created and then translated into a word problem or equation. They illustrate their models...
Curated OER
Is Your Water Clean?
Students compare water quality of different sources. They test water samples for odor, phosphates, pH, bacteria, and dissolved solids. they fill out a data table and answer questions about their findings.
Curated OER
Mathematics Within: Bar And Pie Graphs
Students compare and contrast the use of bar and pie graphs with the same data. They create a data set by surveying all students in the class using sticky notes to make a table on the board. Then, each student creates a bar and pie graph...
Curated OER
Percent-Decimal-Fraction Chart Worksheet
In this percent-decimal-fraction worksheet, students complete a table where one component is given and they find the other two missing equivalent figures, a percent, a decimal or a fraction. The problems on this worksheet are at an 8th...
Curated OER
Colored-Coded Multiplication Cards
In this multiplication cards worksheet, students read 100 multiplication cards from numbers 1 through 10. The cards are color-coded by times table (ex. 8x1, 8x2, 8x3 are all pink).
Curated OER
Data Analysis
In this data analysis worksheet, pupils solve and complete 4 different types of problems. First, they reduce the data provided to find the means, and graph the means in a line graph. Then, students graph the data from each mixture shown...
Curated OER
Money Math
Students explore a story about a room decoration activity to learn about measurements and area. In this measurement lesson, students listen to a story about a boy who is redecorating his bedroom. Students discuss the story and work in...
Curated OER
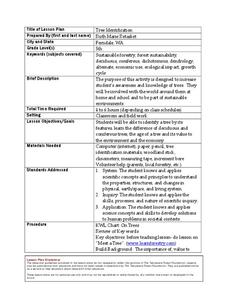
Tree Identification
Students list four ways to identify trees. In this tree identification instructional activity, students use tree identification techniques such as leafs, bark, wood grain, soil type, and climate to create tables and graphs.
Curated OER
Algebra—Quadratic Equations and Functions
Students use given information on wind speed with the quadratic formula to determine the pressure of the wind on a building. In this quadratic equations lesson, students compute the pressure of the wind from two data tables. They graph...
Curated OER
Creating a Nutrition Table in MicroSoftExcel
Middle schoolers access the internet to find Nutritional information from a restaurant of their choice and compile their information into an excel spreadsheet.
Curated OER
Using a Spreadsheet
Young scholars create a spreadsheet to analyze data. In this technology lesson, students develop and use an Excel spreadsheet to log their data. They solve real life word problems as they set it up using the spreadsheet.
Curated OER
Caldecott Medal Winners
Second graders identify Caldecott Medal winners. In this library media lesson, 2nd graders view an overhead transparency of Caldecott Medal winners from 1987-2004 and answer questions based on the data that is displayed.
Curated OER
Art-sculpture
Students demonstrate effective collaboration, the ability to review their own work and that of others, and understand that a sculpture can express a moodor feeling. They listen to "Word Up" by Cameo. Students watch a slide show of...


