Curated OER
One, Two, Three...and They're Off
Students make origami frogs to race. After the race they measure the distance raced, collect the data, enter it into a chart. They then find the mean, median, and mode of the data. Next, students enter this data into Excel at which time...
Laboratory for Atmospheric and Space Physics
Growing Up With A Mission
New Horizons began its journey to Pluto in 2006. Ten years later, it continues its mission. In that time, scholars have surely grown, but how much more will they grow by the time New Horizons reaches its destination? Find out with an...
Curated OER
Drive the Data Derby
Three days of race car design and driving through the classroom while guessing probability could be a third graders dream. Learn to record car speed, distances traveled, and statistics by using calculation ranges using the mean, median,...
Curated OER
Determining Mean, Range, Median, Mode, and Probability
Students calculate mean, median, range, mode and probability. Then, working in teams, they use data from their workplace to compute values for these terms. Finally the class explores the term "probability" using a die.
Curated OER
Statistics - Central Tendency
In this statistics activity, students solve and complete 13 different problems that include creating various box-and-whisker plots. First, they write a definition for mean, median, mode and range. Then students explain how to determine...
Curated OER
How Alike Are We?
Fourth graders find the range, mode, median, and mean for each of the data sets (height and shoe size). They discuss which measure of central tendency for each data set best represents the class and why. Students graph the shoe size and...
Curated OER
Cumulative Frequency - Mental Tests
In this measures of central tendency worksheet, quick-thinking pupils use mental math to find the mean, median, and range of samples. They use mental math to calculate subtraction problems. They complete 20 problems in which the answers...
Curated OER
Digger and the Gang
Help online friends Digger and Sprat from the BBC series to solve math problems! In a series of activities, your class will use data sets to calculate measurements, averages, means, and probabilities. The class completes worksheets and...
Curated OER
More Jelly Bean Math
Students use their color categorized jelly beans to find the range, mean, median and mode. They use their recorded data documenting how many jelly beans there are for each color in order to calculate the range, mean, median and mode of...
Curated OER
Technology vs. Nontechnology
Fourth graders determine the range, mean, median and mode using a computer spreadsheet. An identical set of calculations is done without using a computer. The results of each method are compared. They calculate the mode, median and range...
Curated OER
Find the Range #1
In this mean, median, mode, and range learning exercise, students find the mean, median, mode, and range of a group of one digit numbers with numbers up to 9. Students complete 6 problems total.
Education Development Center
Creating Data Sets from Statistical Measures
Explore the measures of central tendency through a challenging task. Given values for the mean, median, mode, and range, collaborative groups create a set of data that would produce those values. They then critique other answers and...
Curriculum Corner
Measures of Central Tendency
Reinforce the concept of central tendency—mean, median, mode, and range—with a practice packet that comprises of eight problems and a structured answer sheet with plenty of room to show work.
US Department of Commerce
Commuting to Work: Box Plots, Central Tendency, Outliers
Biking may be an outlier. Using data from 10 states on the number of people reporting they bike to work, pupils calculate the measures of center. Scholars determine the range and interquartile range and find which provides a better...
Curated OER
The Mean, the Median, and the Mode
For this statistics and probability worksheet, students analyze data to determine the mean, median, or mode as indicated for the given set of data. The four page worksheet contains a combination of twenty-five multiple choice and free...
Curated OER
Shedding Light on the Weather with Relative Humidity
Learners study weather using a graphing calculator in this lesson plan. They collect data for temperature and relative humidity for every hour over a day from the newspaper, then place the data in their handheld calculator and examine it...
Curated OER
Probability and Statistics
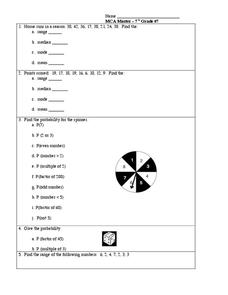
In this probability and statistics activity, students complete 5 problems regarding range, mean, median, mode, and a spinner probability problem.
Curated OER
Stem-and-Leaf Plots
Seventh graders study steam-and-leaf plots. Given specific data, they create a stem-and-leaf plot . Students identify the mean, mode, range and median. Afterward, they review vocabulary words.
Curated OER
Flicking Football Fun
Young mathematicians fold and flick their way to a deeper understanding of statistics with a fun, hands-on math unit. Over the course of four lessons, students use paper footballs to generate data as they learn how to create line...
Shmoop
Box, Stem-Leaf, and Histogram
A helpful and versatile worksheet requires young mathematicians to analyze data in order to create graphs and answer questions. Additionally, it prompts learners to find the mean, median, mode, and range of some of the data sets.
Curated OER
Mathematical Modeling
Study various types of mathematical models in this math lesson plan. Learners calculate the slope to determine the risk in a situation described. They respond to a number of questions and analyze their statistical data. Then, they...
Utah Education Network (UEN)
Statistics
Find the value in analyzing data values. Statistics is the focus in the fifth of seven installments of the 6th Grade Math series. Individuals learn to examine dot plots, histograms, and box plots by considering the shape, mean, median,...
K20 LEARN
You’re The Network: Data Analysis
How do you rate? Young scholars use graphical data to analyze ratings of different television episodes. Their analyses include best-fit lines, mean, median, mode, and range.
Curated OER
Describing Range and Measures of Central Tendency in Shoe Sizes
Students describe the range and various measures of central tendency using shoe sizes from a video. In this range and measures of central tendency lesson plan, students use the same data set to identify the concepts of range, mode,...
Other popular searches
- Mean Median Mode Range
- Mean, Median, Mode Range
- Mean, Median, Mode, Range
- Mean Median Mode and Range
- Range, Mean, Median, Mode
- Mean, Median, Mode, and Range
- Mean, Median, Mode and Range


