Curated OER
Averages
In this averages worksheet, students complete word problems where they find the average (sometimes called 'mean') of numbers. Students complete 10 multiple choice word problems.
Curated OER
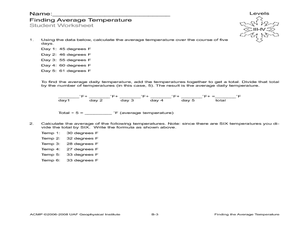
Finding the Average Temperature
Students calculate averages. In this average temperature lesson, students collect data and use their problem solving skills to calculate average temperatures.
Curated OER
Perplexing Patterns
Seventh graders identify and find missing patterns. In this algebra lesson, 7th graders investigate numbers and sequences and complete the pattern. They make a chart and discuss similarities and differences.
Alabama Learning Exchange
The State Capital of Stem and Leaf
Students explore the concept of stem and leaf plots. In this stem and leaf plots lesson, students plot the 50 US states' capitals on a stem and leaf plot according to the first letter of each state. Students compare their stem and leaf...
Curated OER
What I Didn't Know...
Students practice creating wikis. In this wiki instructional activity, students create a wiki about any math topic that they know nothing about. Students learn about their topic and create a wiki that explains the math topic in detail.
Curated OER
Macbeth Madness
Students research Macbeth online and complete computer and graphing activities for the play. In this Macbeth activities lesson, students research Macbeth and bookmark the URL's. Students complete activities for the topic on spreadsheets...
Made by Educators
Sociological Methods
First year undergraduate sociology students can prepare for their exams with an application that provides practice questions in six categories: Quantitative and Qualitative Data, Sources of Data, Primary and Secondary Data, Positivism...
Curated OER
Probability: The Study of Chance
Learners conduct an experiment, determine if a game is fair, and collect data. They interpret data, then display line graph. They conduct analysis of game for probability.
Curated OER
Raisin the Statistical Roof
Use a box of raisins to help introduce the concept of data analysis. Learners collect, analyze and display their data using a variety of methods. The included worksheet takes them through a step-by-step analysis process and graphing.
Curated OER
Mean Absolute Deviation in Dot Plots
The lesson focuses on the ideas of dot plot representations and the mean absolute deviation of data sets.
Illustrative Mathematics
Puppy Weights
Nobody can say no to puppies, so lets use them in math! Your learners will take puppy birth weights and organize them into different graphs. They can do a variety of different graphs and detail into the problem based on your classroom...
Curated OER
Schoolyard Bird Project
Students observe and count bird sightings around their schoolyard throughout the school year.
Curated OER
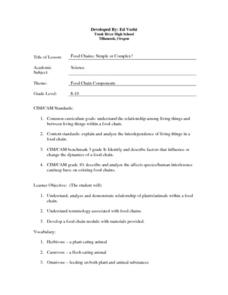
Food Chains: Simple or Complex?
Students explore the relationships within the food chain between plants and animals. They construct modules of food chains, keeping them simple and not complex. They focus on what the animals eat and not on what eats it.
Curated OER
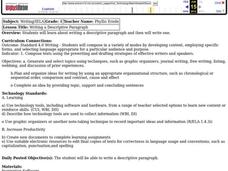
Writing Descriptive Paragraphs
Show a Powerpoint presentation about descriptive writing. Fourth graders brainstorm a list of writing topics and place them in graphic organizers. Then they write their own paragraphs describing topics of their choice and create...
Alabama Learning Exchange
I Know What You Did Last Summer: A Data Graphing Project
Young scholars participate in graphing data. In this graphing data lesson, students make a stem and leaf plot of their summer activities. Young scholars create numerous graphs on poster boards. Students discuss the differences between...
Curated OER
Make a Frequency Table and a Histogram for a Given Set of Data
For this data recording and data organization worksheet, students create one frequency table and one histogram for a given list of data. Explanations and examples for frequency tables and histograms are given.
Curated OER
Exploring Data Sets and Statistics in Baseball
Learners explore the concept data sets. In this data sets lesson plan, students find the 5 number summaries for salaries of teachers and compare them with 5 number summaries of professional baseball players. Learners use box and...
Curated OER
Statistics with State Names
Students analyze the number of times each letter in the alphabet is used in the names of the states. In this statistics lesson, students create a stem and leaf plot, box and whisker plot and a histogram to analyze their data.
Curated OER
Why We Need Sleep
Fifth graders track how much sleep they get and list reasons sleep is important. In this health and math lesson, 5th graders keep up with their sleep times for a week and make notes about how they feel each day prior to the lesson. The...
Curated OER
Water Cycle Bag
Students enclose water in an airtight bag and leave it in a warm area to view the water cycle. In this water cycle lesson plan, students observe evaporation, condensation, and precipitation. They then discuss what they learned about the...
Curated OER
Convection and Wind
Students use water, beakers, hot plates, paper dots, and goggles to participate in a hands on activity where they see how a convection current creates wind. In this convection current lesson plan, students participate in a hands on...
Curated OER
Recognize, create and Record Simple Repeating Patterns
Students analyze, create, and record repeating patterns. In this geometry instructional activity, students create shapes using patterns and keep track of the different shapes. They incorporate transformation and reflections into their...
Curated OER
Looking for More Clues
Fifth graders explore how to collect data and display it on a bar and circle graph.
Curated OER
The Brain Eater
Students view a video clip about Mad Cow Disease. They identify the challenges of health professionals in dealing with the disease. They work together to complete a Public Health Task Force worksheet. They make recommendations on how...
Other popular searches
- Mean Median Mode Range
- Mean, Median, Mode Range
- Mean, Median, Mode, Range
- Median Mode Range
- Mean Median Mode and Range
- Range, Mean, Median, Mode
- Mean, Median, Mode, and Range
- Median Mode and Range
- Mean, Median, Mode and Range
- Median, Mode, Range


