Curated OER
Cumulative Frequency - Mental Tests
In this measures of central tendency worksheet, quick-thinking pupils use mental math to find the mean, median, and range of samples. They use mental math to calculate subtraction problems. They complete 20 problems in which the answers...
Curated OER
Special Ed. Resource
Ways to organize data is the focus of this math PowerPoint. Students view slides that define and give descriptions of a variety of graphs, and how mean, median, and mode are found. A good visual tool which should benefit almost all types...
CK-12 Foundation
Linear and Non-Linear Function Distinction: Domain and Range of a Function
Functions are special types of relations, but what makes them so special? Pupils use an interactive to slide a vertical line across six different graphs. Ten challenge questions then assess understanding of functions.
CCSS Math Activities
Smarter Balanced Sample Items: 6th Grade Math – Target J
What is the best measure of central tendency? Scholars explore mean, median, mode, range, and interquartile range to understand the similarities and differences. They display data in dot plots, histograms, box plots, and more as part of...
US Department of Commerce
Commuting to Work: Box Plots, Central Tendency, Outliers
Biking may be an outlier. Using data from 10 states on the number of people reporting they bike to work, pupils calculate the measures of center. Scholars determine the range and interquartile range and find which provides a better...
Curated OER
Under the Weather
Young scholars review mean, median, mode, and range while using the newspaper to answer weather questions.
Curated OER
Global Statistics
Students select appropriate data to determine the mean, median, mode and range of a set of data. They calculate the statistical data on literacy rates and life expectancy within each geographic region of the world. Students determine...
Curated OER
Modes in Music
In this musical modes worksheet, students review the modes in melodic compositions. They review a chart of the authentic and plagal modes. They review a melody using the information that is given about the notes that are used. There are...
Queensland Government
Means, Modes And Medians
Middle schoolers identify the mean, mode, and median of the heights for males and females who are age 13. They describe the difference between the three words and what each signifies. Finally, pupils fill in a table and calculate the...
Curated OER
Survey: What Shape Has More In the Lucky Charms Box?
In this Lucky Charms activity, students identify the shapes in the box, and using tally marks, count how many of each shape are included. This activity may be used in elementary grades, for counting and tally purposes, but it also can be...
Curated OER
Home on the Range
Third graders see how to find the range of a set of numbers by analyzing data. After a lecture/demo, student pairs practice finding mode and range by solving problems put up on the board by the teacher.
Pace University
Grades 7-8 Mean, Median, and Mode
Take a central look at data. The differentiated lesson provides activities for pupils to calculate central tendencies. Scholars begin choosing three central tendency activities from a Tic-Tac-Toe board. Learners then choose from sports,...
National Security Agency
Are You Ready to Call the Guinness Book of Records?
Learners design questions that can be answered by collecting data. In this line-plot lesson, pupils collect data and graph on a line plot on world records. An abundant supply of teacher support is provided in this resource.
Curated OER
Range and Mode
In this range and mode worksheet, students read the math word problems and the numbers within the problem to help find the range and mode for each problem.
Curated OER
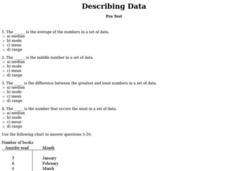
Describing Data
In this data instructional activity, students complete multiple choice questions about mean, median, mode, and range. Students complete 10 questions total.
Curated OER
Averaging
Sixth graders explore the concept of mean, median, mode, and range. In this mean, median, mode, and range lesson plan, 6th graders work in groups to find the mean, median, mode, and range of their heights, distance from home to school,...
Curated OER
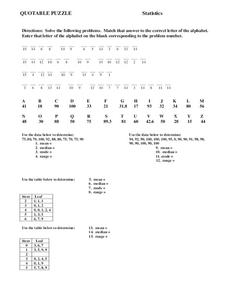
Statistics
For this statistics worksheet, 8th graders solve and complete 15 different problems. First, they solve each problem by using the data given to determine the mean, median, mode, and range for each set. Then, students match that answer to...
Curated OER
Data Analysis
In these data analysis worksheets, students complete 4 worksheets of activities for analyzing data. Students use the mean, median, mode, and range to organize the data.
Curated OER
Family Size
In this family size worksheet, learners complete a tally chart to determine data from a family size line plot. They organize the data in the chart to determine the mean, median, mode, and range of the data. There are six problems in...
Curated OER
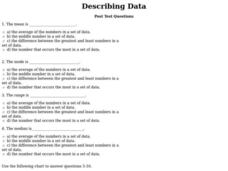
Describing Data
In this describing data worksheet, students answer multiple choice questions about mean, median, mode, and range. Students complete 10 questions total.
Curated OER
Range, Mean, Median, Mode
Students research the impact of craters. In this range, mean, median and mode lesson, students complete an experiment with a marble to simulate the effects of a crater. Students collect and analyze data finding the range, mean, median...
Curated OER
Measures of Central Tendency
In this measures of central tendency worksheet, students find the mean, mode and range of given sets of data. They interpret box-and-whisker graphs and stem-and-leaf plots. This two-page worksheet contains eleven multi-step problems.
Curated OER
Data Analysis
In this data analysis activity, students answer 4 questions using a weather report chart. Topics include mean, median, mode and range.
Curated OER
Making Data Meaningful
For this sample mean worksheet, students explore different ways "average" is used. Students use this information to find the sample mean of the height of a large class of students. Students find the mean, median, mode and range of two...
Other popular searches
- Mean Median Mode Range
- Mean, Median, Mode Range
- Mean, Median, Mode, Range
- Median Mode Range
- Mean Median Mode and Range
- Range, Mean, Median, Mode
- Mean, Median, Mode, and Range
- Median Mode and Range
- Mean, Median, Mode and Range
- Median, Mode, Range


