Curated OER
Moon Mining
Go on a moon mining expedition from the safety of your classroom with this space exploration simulation. Using simple models of the moon's surface prepared ahead of time by the teacher, young scientists are challenged with locating and...
Curated OER
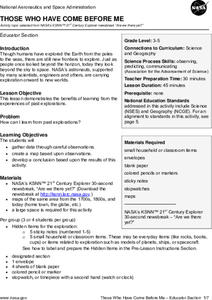
Those Who Have Come Before Me
Class members are transformed into explorers as they work in groups to locate hidden items and map their journey along the way. They then leave clues for other groups of students to follow, and ultimately discover how past explorations...
Curated OER
Linkages Between Surface Temperature and Tropospheric Ozone
Students use data microsets of mean near-surface air temperature and tropospheric ozone residual averages to infer patterns. Students analyze changes in tropospheric ozone and then hypothesize about the consequences of these changes.
Curated OER
How Much Water is Available in the Atmosphere for Precipitation?
Students explore the relationship between the amount of water in the atmosphere available for precipitation and the actual precipitation observed by satellite. They examine seasonal changes in precipitation. They practice using Internet...
Curated OER
Coral Bleaching in the Caribbean
Students practice analyzing images, maps and graphs from Internet-based educational resources. They explore the correlation between sea surface temperature and coral bleaching. Students comprehend that coral reefs are collections of tiny...
Curated OER
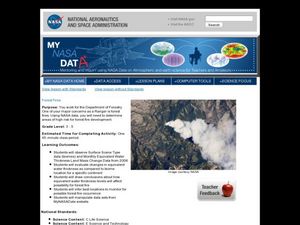
Forest Fires
Young scholars play the role of a Ranger with the Department of Forestry. For this forest fires lesson, students examine data on biomes and images to determine high risk areas for forest fires to develop.
Curated OER
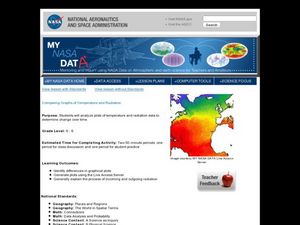
Comparing Graphs of Temperature and Radiation
Middle schoolers study plots and use a Live Access Server to generate plots. In this temperature lesson students examine the process of incoming and outgoing radiation.
Curated OER
Hurricanes As Heat Engines
Students examine sea surface temperatures to see how hurricanes get heat from the oceans surface. In this hurricanes lesson students use the Internet to find data and make line plots.
Curated OER
Is Grandpa Right, Were Winters Colder When He Was a Boy?
Students compare current weather data to historic data to see if there is a temperature change. For this weather lesson students complete a lab activity and determine average changes in temperature, precipitation and cloud cover.
Curated OER
Is Portland, Oregon Experiencing Global Warming?
Students use data to determine if the climate in Portland has changed over the years. In this weather lesson students complete line graphs and study long wave radiation.
Curated OER
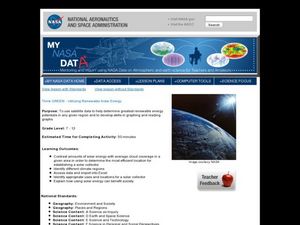
Think GREEN - Utilizing Renewable Solar Energy
Learners use data to find the best renewable energy potential. In this solar energy lesson students import data into Excel and explain how solar energy is beneficial.
Curated OER
Investigating Seasonal Variability in NO2 Concentrations
Young scholars study different formats of data and determine the nitrogen dioxide concentrations. In this seasons lesson students understand the different relationships that NO2 can have.
Curated OER
Ocean Impacts of an El Nino Event
Students study sea surface height and temperature and other characteristics of an El Nino. In this ocean impacts lesson students examine the factors that influence an El Nino or La Nina.
Curated OER
Carbon Monoxide and Population Density
Tenth graders investigate the carbon monoxide level at a fixed latitude. They determine if there is a relationship to population density. They download data sets and generate a graph. They determine a link between human activity and...
NASA
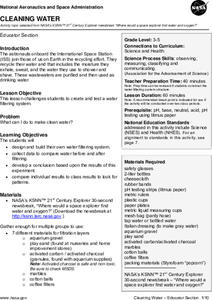
Cleaning Water
Give young scientists a new appreciation of fresh, clean drinking water. After learning about the ways astronauts recycle their air and water, your class will work in small groups creating and testing their very own water filtration...
Curated OER
Investigating the Climate System: Energy, A Balancing Act
Earth science explorers design an experiment to demonstrate that the albedo of a surface affects its temperature. They test to find out if moisture on the surface affects temperature. They discover whether or not concrete or asphalt heat...
Curated OER
Does Humidity Affect Cloud Formation?
Students use S'COOL data to identify factors that affect cloud formation. They find a data set using the S'COOL database , and use Excel to manipulate the data. Student isolate relevant data, create meaningful graphs from a spreadsheet,...
Curated OER
Analyzing Tree Rings to Determine Climate Change
Students examine how to locate and access data sets. In this climate change instructional activity students import data into Excel and graph it.
Curated OER
Dry Season and 'Green' Season in Costa Rica
Students explore the seasonal changes in Costa Rica. In this dry season activity students use the Internet to locate science data then generate data for precipitation.
Curated OER
The Solstices
Compare surface temperatures when the solstice occurs in the different hemispheres. Young scientists draw conclusions from their investigation of data collected using spreadsheets and a globe.
Curated OER
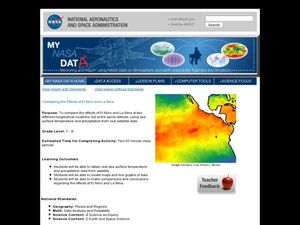
Comparing the Effects of El Nino and La Nina
Students examine the differences between an El Nino and La Nina year. For this investigative lesson students create maps and graphs of the data they obtained.
Curated OER
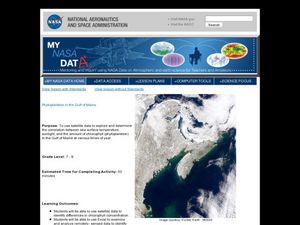
Phytoplankton in the Gulf of Maine
Learners use satellite data to see the correlation between sea temperature and sunlight in the Gulf of Maine. For this phytoplankton lesson students use Excel to analyze data.
Curated OER
The Fabled Maine Winter
Learners graph and analyze scientific data. In this research lesson plan students use the Internet to obtain data then draw conclusions about what they found.
Curated OER
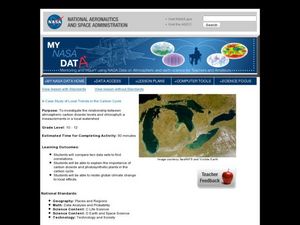
Case Study of Local Trends in the Carbon Cycle
Students examine the relationship between chlorophyll and carbon dioxide in the atmosphere. In this investigative lesson plan students study the local effects of climate change.
Other popular searches
- Nasal Passages
- About Nasa
- Nasa Planets
- Nasa Robots
- Nasa Lesson Math
- Nasa Aircraft
- Nasa Materials
- History of Nasa
- Nasa Lesson Plans
- Nasa Web Based Textbook
- Nasa Aurora
- Contributions of Nasa


