Yummy Math
Going to the Game (systems)
Seven real-life math problems require the solving of simultaneous pairs of linear equations. Although a similar approach is taken for most of the problems, the topic of sports stadium concessions should keep the interest level high. As a...
Curated OER
Shaquille O'Neal Hand/Foot Span: Student Worksheet
Here's a clever math worksheet that has learners measure their hand span, foot length, come up with a ration, then use that information to figure out the hand span, and foot length of basketball giant Shaquille O'Neal. A good activity!
Curated OER
Shaquille O'Neal Hand & Foot Span
If Shaquille O'Neal wears a size-20 shoe, how big are his hands? Learners will use the average ratios of foot length to hand span to calculate the hand span of Shaq, but first, they have to collect the data! They will...
Curated OER
Non-Random Variables: NBA Championship
Students demonstrate probability distribution of non-random variables. Students collect data on the NBA Championships. They record the data and compute subsets and permutations.
Curated OER
Paper Toss Shootout
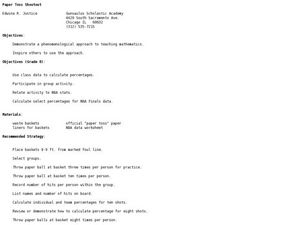
Students explore the concept of percentages. In this math lesson, students throw paper at wastebaskets as if shooting a basketball in a hoop. Students shoot the paper a given amount of times and then calculate their shooting percentage....
Curated OER
On the Road Again
Students work with patterns to develop formulas that will help them determine total cost. For this patterning lesson, students watch a video about an NBA trainer. (not included) They work in groups to access the assigned Internet...
Curated OER
Science of Special Effects
This is a creative, multidisciplinary, well-designed instructional activity provided by Scientific American related to special effects. Students make their own animated short films and use math and computer skills.
Virginia Department of Education
Field Goals, Balls, and Nets
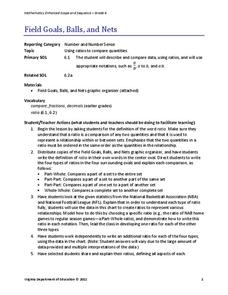
Score a resource on ratios. Young mathematicians learn about different ways to express ratios. Using sports data, they write statements about the statistics in ratio form.
Curated OER
Understanding Proportions and Scale Drawings
Proportions are ratios found using multiplication or division. Middle schoolers solve measurement problems, find a figure's missing dimension, and find the distance between two points. Resource features four lesson plans with detailed...
Curated OER
Statistics: Standard Deviation and Outliers
In this statistics worksheet, statisticians construct a stem-plot and answer questions regarding the shape of the distribution, standard deviation, and outliers.
Curated OER
What's Your Shoe Size? Linear Regression with MS Excel
Learners collect and analyze data. In this statistics activity, pupils create a liner model of their data and analyze it using central tendencies. They find the linear regression using a spreadsheet.
Curated OER
Shaquille O'Neal Hand/Foot Span
Shaquille O'Neal has huge hands and feet, and learners will use those two measurements to practice collecting and extrapolating data using ratios. They record the measurement of foot and hand span of several of their classmates, then...
Curated OER
Probability
Eighth graders relate real life events with probability. In this probability lesson, 8th graders investigate using coin toss, discuss NBA shooting percentages and MLB batting averages. Students also complete a worksheet.
Curated OER
How Many Ways Can A Team Win A 7-Game Series?
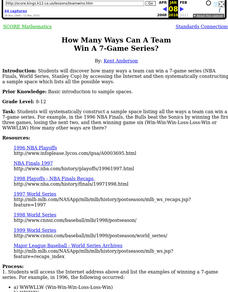
Students discover how many ways a team can win a 7-game series (NBA Finals, World Series, Stanley Cup) by accessing the Internet. They view sites that cover a variety of sports.
Curated OER
The Bigger they Are . . .
Students do a variety of data analyses of real-life basketball statistics from the NBA. They chart and graph rebounding, scoring, shot blocking and steals data which are gathered from the newspaper sports section.
Curated OER
Fantasy Basketball
Students play Fantasy Basketball in order to practice locating Internet information and using technology tools to display data; students demonstrate an understanding and use of graphing, probability, and statistics.
Curated OER
Figure This Out
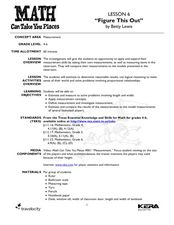
Students measure different parts of the human body. In this measurement lesson, students work in pairs to take measurements of human measurements which include: arm span, height, foot length, and wrist to longest finger. They also...
Curated OER
Range, Mean, Median and Mode Through the Internet
Students compute measures of central tendency. In this range, mean, median and mode lesson, students gather information on the internet, organize the data and then compute the measures of central tendency. They create a...
Curated OER
What Time Is It?
Fourth graders distinguish between analog and digital clocks and read time from both types. In this clock reading lesson, 4th graders discuss the types of clocks and the time zones. Students find times in specific time zones. Students...
Curated OER
Assessing Normalcy
Learners define normal distribution as it relates to the bell curve. In this statistics lesson plan, students use the central tendencies of mean, median and mode to solve problems. They plot their data and draw conclusion from the graphs.
Curated OER
Shaquille O'Neal Hand/Foot Span
Eighth graders measure foot length and hand span in this experiment to determine the ratio. They apply the ratio to determine Shaquille O'Neal's hand span if given his shoe size.
Curated OER
Equations 1
Students discuss the meaning of balance and how it applies to equations. After listening to a lecture, they practice solving equations with two orders of operation and doing whatever they do on one side to the other side as a class. To...
Curated OER
Look at It from the Right Angle
Students investigate how geometry can be used in the field of fitness and physical performance. They view a video that demonstrates how doctors and therapists mention geometry as they treat sports-related injuries.
Curated OER
Tech Algebra: A Statistics Study
Students use the internet to gather a minimum of thirty pieces of data. Students create box and whisker graphs, and stem and leaf plots from the information. They calculate mean, median, mode, and range. Students write a summary and...


