Curated OER
WINDMILL POWER
Learners study operations with real numbers using mental computation or paper-and-pencil calculations. They judge the reasonableness of numerical computations and their results. They set up and solve proportions for direct and inverse...
Achieve
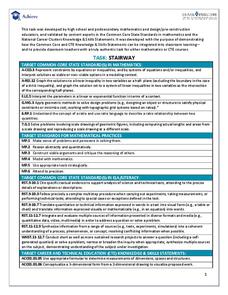
Stairway
It's the stairway to learning! Scholars research all aspects of building a staircase. Using information from building codes, they write and graph a system of inequalities to analyze the constraints. The completed project is a scale model...
Illustrative Mathematics
Lake Algae
Introduce learners to exponential growth with this real-world problem about algae that is rapidly spreading across a lake in a city park. The task presents the rate of growth and an end value and asks learners to determine what happened...
Curated OER
Power, Work and the Waterwheel
Learners use a two-liter bottle, dowel rod and index cards to design and construct a water wheel. They then calculate the power created and measure the work done by the water wheel in Watts and Joules.
Curated OER
Bubble Gum Chemistry
Students explore the concept of graphing data. In this graphing data activity, students determine the percentage of sugar in bubble gum. Students graph type of gum vs. sugar percentage. Students create a table of their data.
Curated OER
What Are The Chances
Students calculate the probability of an event occurring. In this probability lesson, students differentiate between independent, dependent or compound events. They find the range of the data.
Curated OER
Simple Inequalities on a Number Line
Students solve inequalities problems. In this algebra activity, students graph the solution of inequalities on a number line. They discuss boundaries and open or closed intervals.
Curated OER
Topic 6: Evaluating and Presenting Results
Students construct spreadsheets from raw data. In this spreadsheet construction lesson, students compile data into Microsoft Excel. Students familiarize themselves with entering and presenting data in a spreadsheet.
Curated OER
Confusing Colors!
Fourth graders collect data, graph their data, and then make predictions based upon their findings. They's interest is maintained by the interesting way the data is collected. The data collection experiment is from the psychology work of...
Texas A&M University
Wtamu Virtual Math Lab: College Algebra: Systems of Nonlinear Equations
Learn how to solve a system of nonlinear equations using the substitution and the elimination methods. This tutorial offers definitions, problems and step-by-step solutions, and practice exercises for you to complete and check.
Khan Academy
Khan Academy: Linear and Nonlinear Functions
Determine if a relationship is linear or nonlinear. Students receive immediate feedback and have the opportunity to try questions repeatedly, watch a video, or receive hints.
Texas Instruments
Texas Instruments: Nonlinear Pendulum Problems
In this activity, students explore the nonlinear model for a simple pendulum. They use the calculator to solve higher order differential equations.
Mangahigh
Mangahigh: Algebra: Form Equations With Exponents
Mangahigh is a website with math games aimed at twelve to eighteen year olds. On this site students form nonlinear equations.
Interactive Mathematics
Interactive Mathematics: Graphical Solution of Non Linear Systems
Using the graphing method, several systems of nonlinear equations are solved. Follow each example step by step to see how solutions are derived.
Mangahigh
Mangahigh: Algebra: Form More Complicated Equations
This interactive media source has two parts a learning mode and a practice game mode. The learning mode is where students are guided through understanding the individual pieces and general concept of nonlinear equations. Next, students...
Khan Academy
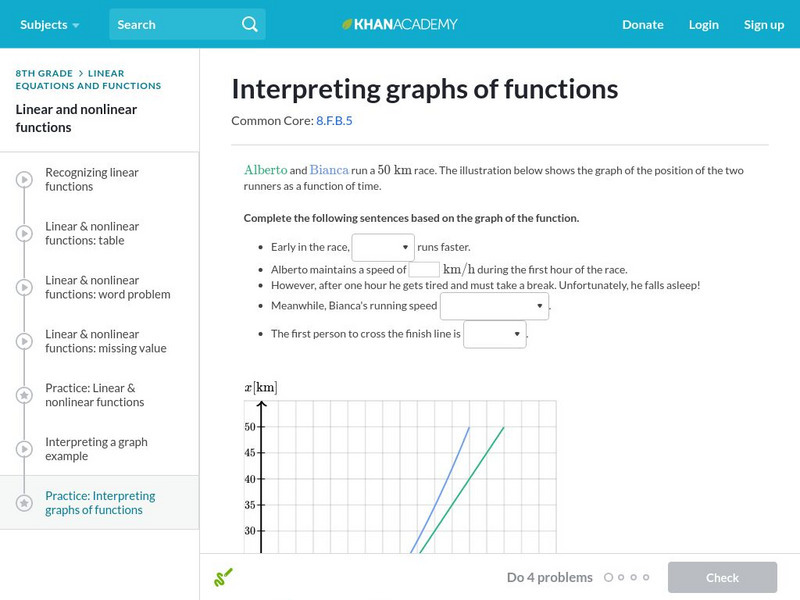
Khan Academy: Interpreting Graphs of Functions
Interpret the graphs of both linear and nonlinear functions. Students receive immediate feedback and have the opportunity to try questions repeatedly, watch a video, or receive hints.
Paul Dawkins
Paul's Online Notes: Algebra: Systems of Equations
Learners examine how to solve systems of equations. Topics investigated are linear systems with two variables, linear systems with three variables, augmented matrices, and nonlinear systems. Class notes, definitions, and examples with...
Interactive Mathematics
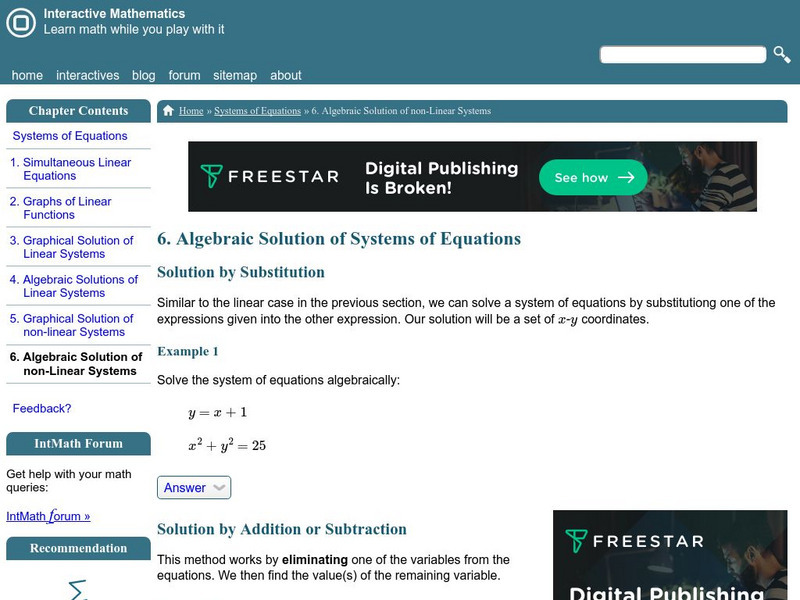
Interactive Mathematics: Algebraic Solutions of Systems
Nonlinear systems are solved using the algebraic methods of substitution and addition/subtraction. Learn how these methods work through detailed examples.
Khan Academy
Khan Academy: Lsn 13: Systems of Equations, Algebraic and Graphical Representations
Lesson 3 of 4 for Passport to Advanced Math. Students will solve systems of equations in two variables in which one equation is linear and the other equation is quadratic or another nonlinear equation; relate properties of the function f...
Quia
Ixl Learning: Linear Equations
Brush up on your math skills relating to linear equations then try some practice problems to test your understanding.
Math Planet
Math Planet: The Graph of Y = Ax^2 + Bx + C
A nonlinear function that can be written on the standard form ax^2 + bx + c,where a is not = 0, is called a quadratic function. All quadratic functions hava a U-shaped graph called a parabola.
Interactive Mathematics
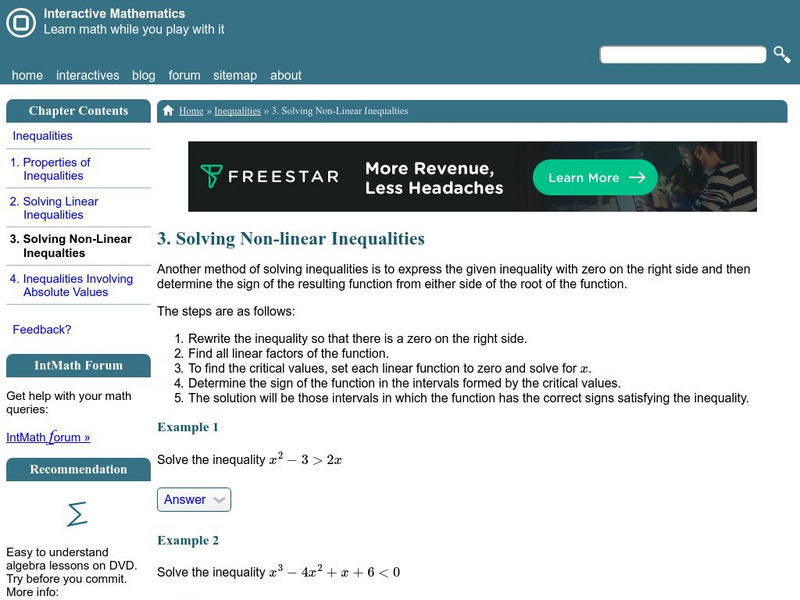
Interactive Mathematics: Solving Non Linear Inequalities
The steps for solving non-linear inequalities are presented along with examples to demonstrate the processes. Examples include equations that contain quadratics, cubics and rational expressions.
Massachusetts Institute of Technology
Mit: Open Course Ware: Differential Equations
The online course consists of educational materials about differential equation. Video lectures, readings, syllabus, exams, interactive mathlets, and assignments with solutions are included.
Texas Instruments
Texas Instruments: Getting Started With the Ti Navigator: Quadratic Equations
This lesson introduces students to Activity Center and is intended to help students write systems of equations in standard form in slope intercept form to solve the system using tables and graphs.


