Curated OER
What Are The Chances
Students calculate the probability of an event occurring. In this probability lesson, students differentiate between independent, dependent or compound events. They find the range of the data.
Curated OER
Saving the Bald Eagle
Students plot on a coordinate plane. In this algebra lesson, students identify points on a coordinate plane and graph lines given coordinate pairs. They create a model as they study bald eagles and their growth and decay.
Curated OER
Simple Inequalities on a Number Line
High schoolers solve inequalities problems. In this algebra instructional activity, students graph the solution of inequalities on a number line. They discuss boundaries and open or closed intervals.
Pennsylvania Department of Education
Alike and Different
Students compare and contrast objects and are introduced to a Venn Diagram. In this alike and different lesson, students make observations regarding properties of objects. Students classify object and build ideas about variables....
Curated OER
Viewing Tubes
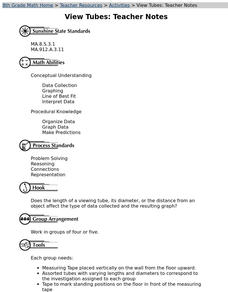
Students complete a lab in order to discover if the length of a viewing tube, its diameter, or the distance from an object affect the type of data collected and the resulting graph.
Curated OER
View Tubes
Eighth graders decide if the length of a viewing tube, its diameter, or the distance from an object affects the type of data collected and the resulting graph through a series of experiments.
Curated OER
Numerical Analysis: Polynomial Interpolation
In this polynomial worksheet, students identify the interpolated and extrapolated value of given equations. This four-page worksheet contains approximately ten problems. Explanations and examples are provided.
Curated OER
Careers
Eighth graders research careers on the computer to determine which career they are interested in. They create a spreadsheet using the Excel program and calculate the budget for their desired lifestyle and determine if this income is...
Curated OER
Topic 6: Evaluating and Presenting Results
Students construct spreadsheets from raw data. In this spreadsheet construction lesson, students compile data into Microsoft Excel. Students familiarize themselves with entering and presenting data in a spreadsheet.
Curated OER
Confusing Colors!
Fourth graders collect data, graph their data, and then make predictions based upon their findings. They's interest is maintained by the interesting way the data is collected. The data collection experiment is from the psychology work of...
Stefan Warner and Steven R. Costenoble
Finite Mathematics & Applied Calculus: Topic Summaries: Non Linear Functions and Models
The topic summary outlines non-linear functions and models. Some topics reviewed are quadratic functions, exponential functions, logistic functions, and logarithms. The resource consists of definitions, notes, and examples.
Other
Graph pad.com: Comparing Linear Regression to Nonlinear Regression
This resource presents a complete and detailed look at linear regression. This guide provides lots of details and graphs to explain each concept.
Stefan Warner and Steven R. Costenoble
Finite Mathematics & Applied Calculus: Quiz: Non Linear Functions and Models
The online quiz assesses student comprehension of math concepts. The quiz consists of true/false questions about non-linear functions and models.
Texas Instruments
Texas Instruments: Mc Dougal Littell Mid. School Math: Graph Non Linear Functions
Students will compare functions by graphing the functions and describing the patterns in the graphs.
PBS
Pbs: The Lowdown: Functional Relationships Between Quantities: Calculating Fuel Consumption
In these interactive visualizations, explore the relationship between calculating miles per gallon (mpg) to gallons per mile in fuel use for vehicles. Most drivers think gas usage falls linearly (in a straight line) as mpg increases. But...
Math Planet
Math Planet: Algebra 1: Exponential Growth Functions
An exponential function is a nonlinear function that has the form of y=a*b^x, where a != 0, b > 0. An exponential function with a > 0 and b > 1, like the one above, represents an exponential growth and the graph of an...
Shodor Education Foundation
Shodor Interactivate: Lesson: Graphs and Functions
This lesson plan is directed at introducing learners to how to graph functions on the Cartesian coordinate plane. They will experience several categories of functions including lines and parabolas. Resources and interactive tools are...
Khan Academy
Khan Academy: Graphs of Nonlinear Piecewise Functions
Given the graph of a nonlinear piecewise function, find its formula.
Texas A&M University
Wtamu Virtual Math Lab: College Algebra: Systems of Nonlinear Equations
Learn how to solve a system of nonlinear equations using the substitution and the elimination methods. This tutorial offers definitions, problems and step-by-step solutions, and practice exercises for you to complete and check.
Texas Instruments
Texas Instruments: Nonlinear Pendulum Problems
In this activity, students explore the nonlinear model for a simple pendulum. They use the calculator to solve higher order differential equations.
Mangahigh
Mangahigh: Algebra: Find the Nth Term of a Nonlinear Sequence
Students explore an interactive tutorial on nonlinear sequences and then practice their knowledge by attempting ten questions that increase in difficulty level.
CK-12 Foundation
Ck 12: Algebra: Linear Interpolation and Extrapolation
[Free Registration/Login may be required to access all resource tools.] Use linear interpolation, linear extrapolation, and the line of best fit to make predictions about a data set.
Quia
Ixl Learning: Linear Equations
Brush up on your math skills relating to linear equations then try some practice problems to test your understanding.
William Mueller
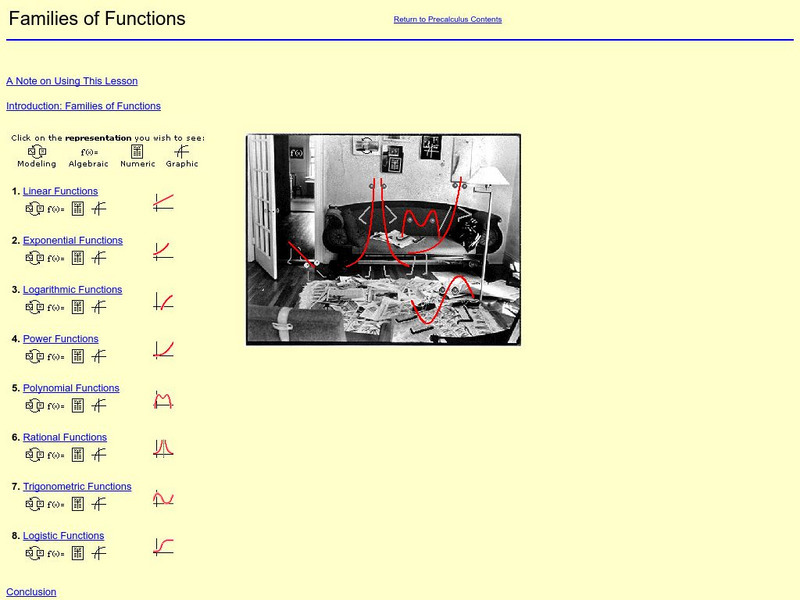
William Mueller: Families of Functions
Meet the Function Family! Each member of the family has examples of their graphs and descriptions of the types of real-world situation that produce those graphs.


