Radford University
A Change in the Weather
Explore the power of mathematics through this two-week statistics unit. Pupils learn about several climate-related issues and complete surveys that communicate their perceptions. They graph both univariate and bivariate data and use...
National Security Agency
Multiple Representations of Limits
After an introductory activity to demonstrate the theory of a limit, additional activities approach a limit from graphical, numerical, and algebraic methods. The activity looks at the multiple ways of understanding and evaluating a limit.
American Statistical Association
Scatter It! (Predict Billy’s Height)
How do doctors predict a child's future height? Scholars use one case study to determine the height of a child two years into the future. They graph the given data, determine the line of best fit, and use that to estimate the height in...
Curated OER
Another Way of Factoring
Focusing on this algebra lesson, learners relate quadratic equations in factored form to their solutions and their graph from a number of different aspects. In some problems, one starts with the original equation and finds the solutions....
Curated OER
Determination of the solubility product of silver(I) chloride
In this chemistry worksheet, students examine the concept of solubility of silver chloride. The sheet has in depth concept and laboratory instructions.
Curated OER
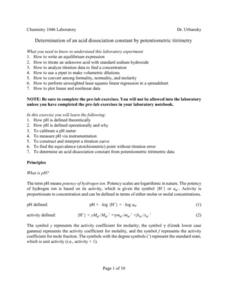
Determination of An Acid Dissociation
In this chemistry worksheet, students examine the given concept in order to apply in the laboratory setting. The sheet includes in depth background information.
American Statistical Association
You and Michael
Investigate the relationship between height and arm span. Young statisticians measure the heights and arm spans of each class member and create a scatter plot using the data. They draw a line of best fit and use its slope to explain the...
American Statistical Association
Scatter It! (Using Census Results to Help Predict Melissa’s Height)
Pupils use the provided census data to guess the future height of a child. They organize and plot the data, solve for the line of best fit, and determine the likely height and range for a specific age.
American Statistical Association
How Tall and How Many?
Is there a relationship between height and the number of siblings? Classmates collect data on their heights and numbers of brothers and sisters. They apply statistical methods to determine if such a relationship exists.
Curated OER
Graham's Appalachian Spring: A Study
Students explore choreographic narrative. In this choreography lesson plan, students explore the elements of Appalachian Spring as they develop a series of written responses to assignments that challenge them to investigate the structure...
Center Science Education
The Nitrogen Cycle Game
Earth science experts learn about the roles of nitrogen by taking a virtual journey through the nitrogen cycle. Completing a passport worksheet along the way, they move from place to place around the classroom by the toss of dice. Each...
Intel
Help Wanted! Physicist
Groups discover physics as they take an assigned scenario, perform research about different aspects of the subject matter, and present their findings to the class. From the presentations, learners must develop and support a point of view...
Curated OER
Rewriting Equations &Formulas
Practice with literal equations. Solve for one variable in terms of another. Find the value of y given specific values of x. This short instructional activity would make a good warm-up activity at the beginning of class or a quick...
Albert Shanker Institute
Economic Causes of the March on Washington
Money can't buy happiness, but it can put food on the table and pay the bills. The first of a five-lesson unit teaches pupils about the unemployment rate in 1963 and its relationship with the March on Washington. They learn how to create...
Curated OER
Worksheet 1
In this math worksheet, students describe the difference between a partial and an ordinary differential equation. They give examples of 1st, 2nd, and 3rd order differential equations. Students apply this information to predator/prey...
Curated OER
Interpreting and Displaying Sets of Data
Students explore the concept of interpreting data. In this interpreting data instructional activity, students make a line plot of themselves according to the number of cubes they can hold in their hand. Students create their own data to...
Inside Mathematics
Vencent's Graphs
I like algebra, but graphing is where I draw the line! Worksheet includes three multiple-part questions on interpreting and drawing line graphs. It focuses on the abstract where neither axis has numbers written in, though both are...
EngageNY
Polynomial, Rational, and Radical Relationships
This assessment pair goes way beyond simple graphing, factoring and solving polynomial equations, really forcing learners to investigate the math ideas behind the calculations. Short and to-the-point questions build on one another,...
Curated OER
Data and Scientific Graphs
Learners conduct experiments and graph their data. In this statistics lesson, students collect data and graph it on a coordinate plane. They analyze the data looking for patterns and they discuss their findings with the class.
Curated OER
Graphing and the Coordinate Plane
Students examine the four quadrants of Cartesian coordinate plane. They play maze games and coordinate games to discover how to read and plot points on the plane. Students plot points on the coordinate plane and examine the ratio of...
Inside Mathematics
Scatter Diagram
It is positive that how one performs on the first test relates to their performance on the second test. The three-question assessment has class members read and analyze a scatter plot of test scores. They must determine whether...
Curated OER
Investigating Correlation
High schoolers investigate different types of correlation in this statistics instructional activity. They identify positive, negative and no correlation as it relates to their data. They then find the line of best fit for the plotted data.
Curated OER
The Window Problem
Students identify patterns and compute formulas to solve the problems. In this algebra activity, students come up with a rule given a pattern, and analyze the relationship between data and graphs.
Curated OER
From Bats to Babies: Ultrasound
Students research and analyze sound waves and how an ultrasound works to image a baby in utero. They explore various websites, complete worksheets, and write a paragraph describing a demonstration they view in the classroom.


