Curated OER
Alice Computer Programming
Students explore multimedia components. In this science inquiry lesson plan, students read "Invitation to the Game" by Monica Hughes and they use the Alice Computer Programming System to better understand population dynamics.
Curated OER
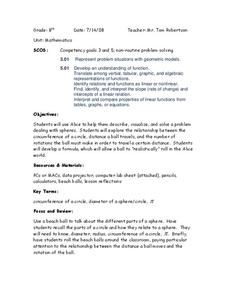
Circle Relationships
Students explore circles. In this geometry lesson plan, students explore the relationship between the circumference of a circle, the distance a ball travels, and the number of rotations the ball must make in order to travel a certain...
Curated OER
Graphing and the Coordinate Plane
Students learn about the Cartesian coordinate plane, understand the four quadrants of the Cartesian coordinate plane, and plot points on the plane. Students read coordinates for a point from a graph and give the ratio of rise over run...
Curated OER
Introduction to Arithmetic and Geometric Sequences
Students examine the concept of sequences. Students create a sequence using varied starting numbers, multipliers, and add on values. Students practice determining the starting values to use in order to produce a desired sequence.
Curated OER
World Wide Web
Learners are able define or describe what the Internet is and how it developed. They are able to Describe an IP packet and what is meant by the phrase "packet switching network". Students are able to describe the World Wide Web. They are...
Curated OER
Between The Extremes
Students analyze graphs for specific properties. In this algebra lesson, students solve equations and graph using the TI calculator. They find the different changes that occur in each graph,including maximum and minimum.
Curated OER
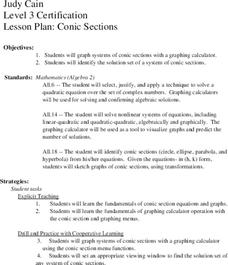
Conic Sections
Students, while using a graphing calculator, graph systems of conic sections as well as identify their solutions. They complete various word problems dealing with conic sections with their calculators. In addition, students sketch graphs...
Curated OER
My Peanut Butter is Better Than Yours!
Young scholars explore the concept of statistical data. In this statistical data lesson, students read an article about the dangers of peanut butter to those who are allergic. Young scholars perform a taste test of two different brands...
Alabama Learning Exchange
The State Capital of Stem and Leaf
Students explore the concept of stem and leaf plots. In this stem and leaf plots lesson, students plot the 50 US states' capitals on a stem and leaf plot according to the first letter of each state. Students compare their stem and leaf...
Curated OER
Normal Probability Plot
Young scholars analyze the graph of a distribution. For this statistics lesson, students define skewed or mound shape distribution as they investigate the data behind the graph. They define and plot outlier as well as normal probability.
Curated OER
Investing
Pupils collect data on investments and draw conclusions. In this algebra lesson, students analyze exponential graphs as they relate to money. They discuss the cause of an account balance being high or low.
Curated OER
Leaf Patterns
First graders explore the existence of patterns in everyday items. In this science and math integrated lesson, 1st graders match leaves with a name word card and organize them into four patterns. This lesson includes a reading of And the...
Curated OER
Traveling Nitrogen
Students demonstrate and understanding of the nitrogen cycle by taking roles and interacting with others in a simulation activity.
Curated OER
Whirligig Lesson
Learners read a story. In this sequencing lesson, students read a story about a boy's journey across the country. Learners discuss what happened and where he traveled. Students work in groups to create a timeline.
Curated OER
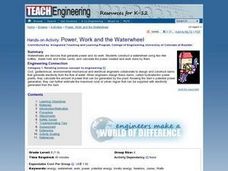
Power, Work and the Waterwheel
Learners use a two-liter bottle, dowel rod and index cards to design and construct a water wheel. They then calculate the power created and measure the work done by the water wheel in Watts and Joules.
Texas Instruments
A Tale of Two Lines
Learners graph systems of equation. In this calculus lesson, students graph their lines on a TI calculator. They identify the point of intersection and the type of solution.
Curated OER
TI-Nspire Activity: What Does Your Representation Tell You?
By learning to select the best representation for three meal plans, learners compare three meal plans to determine the best choice. Data for the meal plans is sorted on a table, as an algebraic equation, and graphed on a coordinate grid....
Curated OER
Basic Algebra and Graphing for Electric Circuits
In this electronics activity, students evaluate mathematical expressions to complete 16 short answer and problem solving questions.
Curated OER
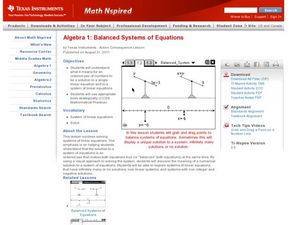
Balanced Systems of Equations
Students solve equations. For this algebra lesson, students relate solving equations to a balanced scale. They add, subtract, multiply and divide on both sides to keep the scale balanced.
Curated OER
WINDMILL POWER
Students study operations with real numbers using mental computation or paper-and-pencil calculations. They judge the reasonableness of numerical computations and their results. They set up and solve proportions for direct and inverse...
Kenan Fellows
Math Made Simple as 1-2-3: Simplified Educational Approach to Algebra
Writing an equation of a line is as easy as m and b. A lesson plan presentation gives individuals different strategies for writing equations of lines. Some items provide a slope and a point while others provide two points. Whatever the...
Achieve
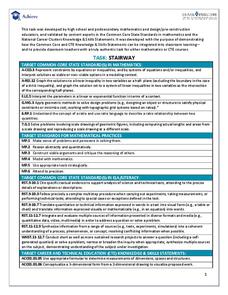
Stairway
It's the stairway to learning! Scholars research all aspects of building a staircase. Using information from building codes, they write and graph a system of inequalities to analyze the constraints. The completed project is a scale model...
Illustrative Mathematics
Lake Algae
Introduce learners to exponential growth with this real-world problem about algae that is rapidly spreading across a lake in a city park. The task presents the rate of growth and an end value and asks learners to determine what happened...
Curated OER
Bubble Gum Chemistry
Students explore the concept of graphing data. In this graphing data activity, students determine the percentage of sugar in bubble gum. Students graph type of gum vs. sugar percentage. Students create a table of their data.


