Curated OER
Rainbows, Bridges & Weather, Oh My!
Explore how real-world applications can be parabolic in nature and how to find quadratic functions that best fit data. A number of different examples of modeling parabolas are explored including a student scavenger hunt, the exploration...
Curated OER
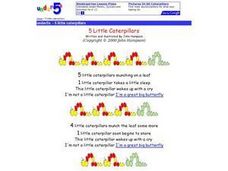
5 Little Caterpillars
Rhymes are great tools that build memorization and engage both sides of the brain. Little learners can read or recite this poem to help them subtract numbers below 5. Five little caterpillars eat, sleep, and change into butterflies...
Curated OER
Sorting
A lesson on classification and sorting is here for you. Elementary schoolers participate in an interactive computer game in which they sort books by theme. They take a trip to the library to observe and discuss how books are sorted, and...
Curated OER
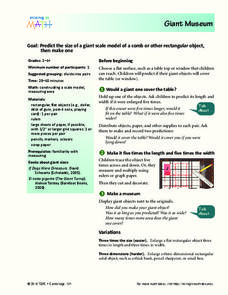
Giant Museum
Scholars make a giant scale model of an object. They will take a regular item and enlarge it to five times its length and width. They attempt this same concepts with a 3D model.
Curated OER
Graphs that Represent Data Sets
Use these pre-made data sets to introduce kids to bar graphs and data analysis, and then have them take surveys on their own. There are 10 survey scenarios written out here, and scholars synthesize the results of each into a bar graph....
Out of Africa Wildlife Park
A Thematic Learning Guide to Lions
Written as an accompaniment to a field trip to the Out of Africa Wildlife Park in Arizona, this is an interdisciplinary, themed lesson on lions. Even if you cannot take your upper-elementary kids to this attraction, there are a few...
Curated OER
Identifying Terms, Factors, and Coefficients
What are terms, factors, and coefficients? This slideshow provides definitions and examples of various parts of algebraic expressions, and provides guided practice problems in writing and identifying parts of algebraic expressions for...
Curated OER
Mean and Standard Deviation
Get two activities with one lesson. The first lesson, is appropriate for grades 6-12 and takes about 20 minutes. It introduces the concept of measures of central tendency, primarily the mean, and discusses its uses as well as its...
Curated OER
Electricity
Cute cartoons and diagrams help explain electric charge to your physical science buffs. No math is involved even though units for electric charge and voltage are mentioned. This is a pretty neat and straightforward note taking guide for...
Curated OER
Addition and Subtraction Word Problems
Here are three word problems that will put your scholars' addition and subtraction skills to the test! They read about penguins, horses, and hockey pucks, using images as clues. Since these problems have a lot of unnecessary information,...
Curated OER
Designing the Perfect Science Fair Project Webquest
Sixth graders examine the Scientific Method and define their topic of interest. Students familiarize themselves with how to utilize their resources and create note cards. Students create their written report and display of their...
Curated OER
Math Word Problems: Chapter 1 Investgation
In this math investigation worksheet, 4th graders read facts pertaining to the Seattle Space Needle. Students note the numbers used to count and those used to measure in the description.
Sinclair Community College
Solving Linear Inequalities
Your learners will appreciate the complete picture of linear inequalities presented in this lesson plan. Starting simply with definitions and moving all the way to solving linear inequality word problems this activity is simple to...
Flipped Math
Calculus AB/BC - Connecting Differentiability and Continuity
Despite what you thought, you can differentiate between continuity and differentiability. Using a short lesson, pupils learn how differentiability and continuity relate to each other. It provides three descriptions of when a function is...
Curated OER
Distributive Property
Students use the distributive property to solve problems. After listening to an illustration of the property, they take notes. Students solve problems during note taking and after class. They create their own examples of the...
Illustrative Mathematics
Global Positioning System II
Intricate details of a modern technology that many of us take for granted in our phones, computers (and some cars) are laid bare in a short but deeply investigative activity. The math behind a seemingly simple GPS device...
EngageNY
Events and Venn Diagrams
Time for statistics and learning to overlap! Learners examine Venn Diagrams as a means to organize data. They then use the diagrams to calculate simple and compound probabilities.
Northern Arizona University
Adding and Subtracting Fractions
Pattern blocks and shapes demonstrate how to add and subtract fractions. By aligning blocks with different shapes, learners figure out how to create a whole, and then how to add and delete parts from that whole.
Mathematics Vision Project
Geometric Figures
Logical thinking is at the forefront of this jam-packed lesson, with young mathematicians not only investigating geometric concepts but also how they "know what they know". Through each activity and worksheet, learners wrestle with...
Mathematics Vision Project
Module 6: Trigonometric Functions
Create trigonometric functions from circles. The first lesson of the module begins by finding coordinates along a circular path created by a Ferris Wheel. As the lessons progress, pupils graph trigonometric functions and relate them to...
EngageNY
Mid-Module Assessment Task - Geometry (Module 1)
How do you prepare class members for the analytical thinking they will need in the real world? An assessment requires the higher order thinking they need to be successful. The module focuses on the concept of rigid transformations...
EngageNY
Are All Parabolas Similar?
Congruence and similarity apply to functions as well as polygons. Learners examine the effects of transformations on the shape of parabolas. They determine the transformation(s) that produce similar and congruent functions.
EngageNY
Sampling Variability in the Sample Mean (part 2)
Reduce variability for more accurate statistics. Through simulation, learners examine sample data and calculate a sample mean. They understand that increasing the number of samples creates results that are more representative of the...
EngageNY
Ruling Out Chance (part 2)
Help your classes find the significance in this lesson! Learners analyze the probability of Diff values. They then determine if the difference is significant based on their probability of occurrence.


