Curated OER
Check Subtraction with Addition
In this subtraction learning exercise, students subtract, then check by adding. Problems are set up side by side, with the correct answer to the addition check noted for the student.
Charleston School District
The Sum of Angles in a Triangle
An informative lesson contains a brief explanation of how the sum of the angles of a triangle is a line. The lesson continues with determining the missing angle in a triangle, or solving for a variable. Using the sum of the angles, the...
Teach Engineering
Quantum Dots and the Harkess Method
The Fantastic Voyage is becoming close to reality. The class reads an article on the use of nanotechnology in the medical field and participate in a discussion about what they read. The discussion method helps class members become more...
EngageNY
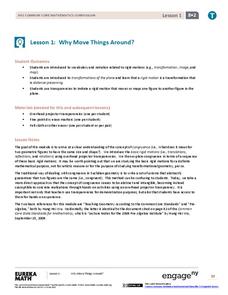
Why Move Things Around?
Explore rigid motion transformations using transparency paper. Learners examine a series of figures and describe the transformations used to create the series. They then use transparency paper to verify their conclusions.
EngageNY
Decimal Expansions of Fractions, Part 2
Develop your pupils' understanding of fractions and their decimal equivalence using the 12th lesson in this series. Scholars learn an alternative to long division that results in converting fractions to decimals that emphasize fractional...
EngageNY
Random Sampling
Sample pennies to gain an understanding of their ages. The 16th installment of a 25-part series requires groups to collect samples from a jar of pennies. Pupils compare the distribution of their samples with the distribution of the...
EngageNY
Sampling Variability
Work it out — find the average time clients spend at a gym. Pupils use a table of random digits to collect a sample of times fitness buffs are working out. The scholars use their random sample to calculate an estimate of the mean of the...
EngageNY
The Relationship Between Visual Fraction Models and Equations
Ours is to wonder why, not just to invert and multiply. The seventh installment of a 21-part module uses fraction models to help pupils understand why the invert-and-multiply strategy for dividing fractions works. They then work on some...
EngageNY
Finding a Rate by Dividing Two Quantities
Develop the right station to solve rate word problems. The 18th lesson in a series of 29 starts by interpreting the aspects of rates with two different quantities. Pupils use the interpretation of rates to solve problems, and groups work...
EngageNY
Percent of a Quantity
Visualize methods of finding percents. Classmates find a percent of a quantity using two methods including a visual model in the 26th lesson in a series of 29. By the end of the lesson, scholars find percents given a part and the whole...
EngageNY
Understanding Box Plots
Scholars apply the concepts of box plots and dot plots to summarize and describe data distributions. They use the data displays to compare sets of data and determine numerical summaries.
EngageNY
Writing and Evaluating Expressions—Multiplication and Division
Don't table the resource on writing expressions for relationships in tables. Scholars investigate relationships between variables and write algebraic expressions involving multiplication and division. These expressions help solve...
EngageNY
Creating a Histogram
Display data over a larger interval. The fourth segment in a 22-part unit introduces histograms and plotting data within intervals to the class. Pupils create frequency tables with predefined intervals to build histograms. They describe...
EngageNY
Describing a Distribution Displayed in a Histogram
The shape of the histogram is also relative. Learners calculate relative frequencies from frequency tables and create relative frequency histograms. The scholars compare the histograms made from frequencies to those made from relative...
Curated OER
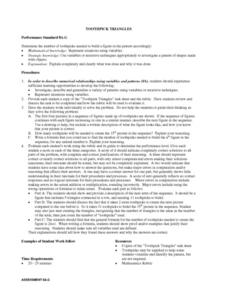
Toothpick Triangles
Learners draw a chart (included in the lesson) to use with their investigation. They review terminology of triangles and receive toothpicks to use in the lesson. Beginning with three toothpicks, students form a triangle. They complete...
Curated OER
Algebra: Coordinates and Straight Line Graphs
Young mathematicians review what they have previously learned about coordinates and straight line graphs. Then, they access an interactive component within the lesson plan to gain more practice with this skill. Additionally, there are...
EngageNY
Chance Experiments
Class members are introduced to probability using terms such as impossible, unlikely, likely, and certain. Numbers between zero and one are associated with the descriptions of probability. Pupils find the likelihood of chance experiments...
Scholastic
Dreidel Game and Song
The dreidel song, or "I Have a Little Dreidel," is a fun traditional song for the season of Hanukkah. Teach your class how to play the dreidel game with an activity that includes the lyrics to the classic song.
BBC
Simple Addition and Subtraction
Here is a wonderful lesson designed for young mathematicians. In it, they employ simple addition and subtraction strategies in order to solve word problems. There are some excellent activity sheets embedded in the plan to make the...
Curated OER
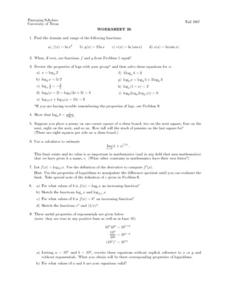
Worksheet 26 - Functions & Logarithms
In this function and logarithms worksheet, students find the domain and range of functions, use the properties of logs to solve equations. This one-page worksheet contains nine multi-step problems.
Virginia Department of Education
Growing Patterns and Sequences
Learners explore, discover, compare, and contrast arithmetic and geometric sequences in this collaborative, hands-on activity. They build and analyze growing patterns to distinguish which kind of sequence is represented by a set of data...
Charleston School District
Comparing and Ordering Irrational Numbers on a Number Line
Estimating the value of numbers is much harder than it sounds! Scholars compare and order the value of numbers presented in different forms including fractions, decimals, roots, integers, and pi. This builds on the previous lessons in...
Curated OER
Tour of the Solar System
Learners engage in science, math, and language activities as they do research on the components of the solar system. The class begins with some anticipatory activities and discussions before it is divided into small groups to conduct...
Curated OER
Elapsed Time Word Problems-- 24 Hour Clock
In this math worksheet, students solve 20 word problems in which they calculate elapsed time to the nearest minute. The page is from the UK- spellings and idioms may be unfamiliar to others. Note: Some times are expressed on a 24 hour...


