Willow Tree
Equations of a Line
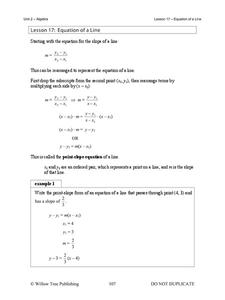
Each form of a linear equation has its purpose — pupils just have to find it. Building on the previous instructional activity in the series, learners examine point-slope and standard form. Using point-slope form, pupils write the...
NOAA
Climographs
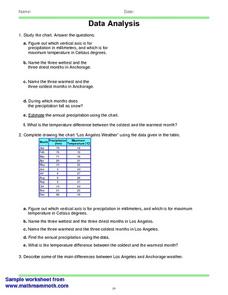
In the second lesson of a five-part series, young climatologists use provided temperature and precipitation data to create climographs of three different cities. They then analyze these climographs to develop a general understanding of...
Curated OER
Walking the Plank
This is a cool math activity. Kids collect and interpret data based on a physical act. A board is balanced between a scale and a step, learners record a peer's weight as it decreases while s/he walks further away from the scale. They...
Curated OER
Understanding Latitude and Longitude
Teaching learners about latitude and longitude can get a little complicated. Present the concept by first representing it as a graph. Just like finding a location on a graph using the x and y-axis, learners will be able to locate items...
Curated OER
Regents High School Examination: Living Environment 2003
The living environment, from the interior of a cell to the complex relationships among populations, are queried in this final examination. Learners look at air pollution maps, diagrams of cells, population graphs, and drawing of cells....
Curated OER
The Impact
Learn about the destruction of the rainforest by analyzing statistics. Young learners make an original line graph showing destruction in the rainforest. Additional activities include making a collage, sequencing Dr. Seuss' The Lorax,...
Curated OER
Dealing With Data
Students collect, organize, and display data using a bar graph, line graph, pie graph, or picture graph. They write a summary describing the data represented and compare the graph to another graph in the class.
Curated OER
Integrated Algebra Practice: Frequency Histograms, Bar Graphs and Tables
In this graphs worksheet, students solve 4 problems about histograms, bar graphs, and tables. Students answer questions about histograms, bar graphs, and tables.
Curated OER
Graphing With Candy
Students gather information and interpret the results using a tally chart, a table, and a bar graph.
Curated OER
Human Population Growth
In this human population growth worksheet, learners create a graph of human population growth and predict future growth using the data given in a chart. Students identify factors that affect population growth.
Pennsylvania Department of Education
Use Order of Operations to Evaluate Expressions—No Grouping Symbols
Students identify and explain different types of data collection and graphs. For this graphs and data collection lesson, students record their observations of a variety of data collection tools and graphs displayed in the room. Students...
Pennsylvania Department of Education
Equal Groups
Students explore statistics by completing a graphing activity. In this data analysis lesson, students define a list of mathematical vocabulary terms before unpacking a box of raisins. Students utilize the raisins to plot data on a line...
Curated OER
Hollywood's Top Ten
Young scholars gather data on top 10 highest grossing movies, and make a bar graph and a pictogram.
Curated OER
Graphing Situations without a Table
Students graph a line without making a table of vales. In this algebra lesson, students are given a verbal scenario and asked to write a linear functions representing the scenario and graph it on a number line without making a table....
Curated OER
Interpreting and Displaying Sets of Data
Students explore the concept of interpreting data. In this interpreting data lesson, students make a line plot of themselves according to the number of cubes they can hold in their hand. Students create their own data to graph and...
Curated OER
Line & Scatter (What Would You Use: Part 2)
Learners discuss line graphs and scatter plots and the best situations in which to use them. Using the graphs, they determine the type of correlation between variables on a scatterplot. They create a scatterplot and line graph from a...
Curated OER
Choosing the Best Graph
In this mathematics worksheet, 6th graders use a line graph to illustrate how a measure of data changes and explain their reasoning. Then they use a bar graph to compare pieces of data and a pictograph to compare data.
Curated OER
Graphs
Students participate in a lesson exploring the concept of using graphs in various types of mathematical problems. They use negative and positive numbers in order to plot a graph. Students should use a place value chart for a reference...
Curated OER
Data Analysis 2
In this data analysis worksheet, students read and interpret given line graphs. They determine the range and average. This one-page worksheet contains five problems.
Curated OER
Line, Ray, Segment
Learners define vocabulary words. In this geometry lesson, students identify the graph as a line, ray or segments. They understand the properties of each and calculate the distance on a number line.
BW Walch
Solving Systems of Linear Equations
Solving systems of equations underpins much of advanced algebra, especially linear algebra. Developing an intuition for the kinds and descriptions of solutions is key for success in those later courses. This intuition is exactly what...
EngageNY
Nature of Solutions of a System of Linear Equations
If at first you cannot graph, substitute. The lesson introduces the substitution method as a way to solve linear systems if the point of intersection is hard to determine from a graph. The 28th installment of a 33-part series finishes...
West Contra Costa Unified School District
Solving Systems of Inequalities
Don't throw away those transparency sheets just yet! Young scholars first review inequalities on a number line, then learn about graphing inequalities in the coordinate plane. Finally, they use overhead transparencies to create systems...
Teach Engineering
Matching the Motion
It is not always easy to walk the straight and narrow. In the sixth portion of a nine-part unit, groups actively recreate a graph depicting motion. Individuals walk toward or away from a motion detector while trying to match a given...


