EngageNY
Solving and Graphing Inequalities Joined by “And” or “Or”
Guide your class through the intricacies of solving compound inequalities with a resource that compares solutions of an equation, less than inequality, and greater than inequality. Once pupils understand the differences, the...
Curated OER
Compound Inequalities and Graphing
Put geometry skills to the test! Learners solve compound inequalities and then graph the inequalities on a coordinate plane using their geometric skills. They identify the slope and y-intercept in order to graph correctly. I like this...
Curated OER
Do These Systems Meet Your Expectations
This lesson is all about systems of equations and their graphs. Algebra learners create and solve systems of equation using tables and graphing. They identify the point of intersection of a system of equation, and discover what the...
Illustrative Mathematics
The Circle and The Line
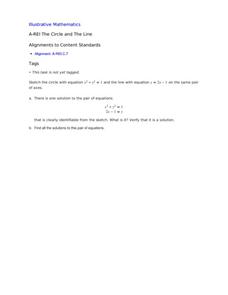
Here is a resource where algebra learners show their understanding of a system of equations involving a circle and a line. Once graphed, learners see two points of intersection, one where the ordered pair is read, and a second where...
Houghton Mifflin Harcourt
Unit 3 Math Vocabulary Cards (Grade 5)
Fifty-four flashcards make up a set to help reinforce math vocabulary. The set offers two types of cards; a word card printed in bold font, and a definition card equipped with an example and labels. Terms include capacity,...
Curated OER
Worksheet 10 - Limits
In this limits worksheets, students graph tangent lines and determine the slope of a secant line. This one-page worksheet contains six multi-step problems.
Curated OER
Review Linear Equations
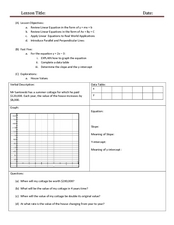
Explore algebra I/algebra II with this series of worksheets. Pupils write linear equations in slope-intercept and standard form, graph linear equations, and apply linear equations to real world applications. The six-page instructional...
Curated OER
Stars and Slopes
More of a math lesson than physics or space science, high schoolers take a set of data and plot it on a log-log coordinate system. The write-up for day two was never completed, but day one, "Stars and Slopes," is complex and cohesive....
Utah Education Network (UEN)
Linear Graphs Using Proportions and Rates
Using a TI-73 or other similar graphing calculator middle school math majors investigate the linear relationship of equivalent proportions. After a brief introduction by the teacher, class members participate in a timed pair share...
Curated OER
Slope, Vectors, and Wind Pressure
A hands-on instructional activity using the TI-CBR Motion Detector to provide information to graph and analyze. The class uses this information to calculate the slope of motion graphs and differentiate scalar and vector quantities. There...
Houghton Mifflin Harcourt
Integers, Opposites, Absolute Value
Straight from the pages of a math textbook, this three-lesson series introduces young mathematicians to the world of integers. Starting with a definition of integers and their applications in the real world, this resource goes on to...
Curated OER
Quantitative Data
In this quantitative data worksheet, pupils compute measures of central tendency, draw vertical line diagrams, and compare collected data. This 23-page worksheet contains approximately 100 multi-step problems. Explanations and examples...
Curated OER
Transformations - Rotations in the Coordinate Plane
In this geometry lesson, math scholars brainstorm examples of rotations. Using the SMARTboard, students observe a rotation. They create their own rotation using graph paper. Finally, pupils complete a worksheet and graph rotations.
Curated OER
Speed
Fifth and sixth graders practice working in pairs to determine whether they can walk with constant speed. They test themselves, collect their data, draw graphs with their data collected, manipulate the data, and then draw conclusions...
Curated OER
Linear Equations
Eighth and ninth graders solve and graph 42 different problems that include writing various equations and graphing them on a grid. First, they create a table for each equation and graph it on a grid locating the x-and y-intercepts. Then,...
Illustrative Mathematics
Sore Throats, Variation 2
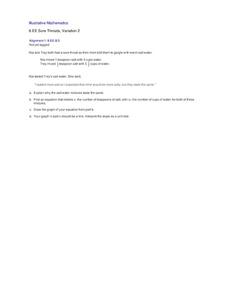
What does math have to do with a sore throat? When you mix water and salt you have a great review of how to represent proportional relationships by an equation or graph. Here the proportions of the mixtures may be different, but the...
Curated OER
Show Me The Data!
Pupils create a bar graph. They will collect and organize data to turn into bar graphs. They create graphs for the favorite sports of the class, color of M&M's, and types of cars passing by.
Curated OER
Profitable Soda Stand
Am I making any money? Help learners determine if their fictitious soda stand is turning a profit. They graph linear equations using the slope and y-intercept and identify the best price to use to sell soda. They identify the domain and...
Baylor College
Water: The Math Link
Make a splash with a math skills resource! Starring characters from the children's story Mystery of the Muddled Marsh, several worksheets create interdisciplinary connections between science, language arts, and math. They...
Curated OER
Science: Teddy Bear Nation
Students sort teddy bears according to types and then graph the results. They each bring a bear to class and then discuss their similarities and differences. Once the bears have been sorted into groups according to size and color,...
Curated OER
Matrix Analysis of Networks
Explore the connection between a finite graph, a directed graph, and a matrix. Graph lines and identify the relationship of matrices in real-world scenarios. Then use this information to work with a partner to plan and design a...
Curated OER
Range, Mode, and Median
Fifth and sixth graders sort data from least to greatest and mark an X on the line plot to show how many of each number. Then they determine the range, mode, and median for the problem.
National Council of Teachers of Mathematics
Eruptions: Old Faithful Geyser
How long do we have to wait? Given several days of times between eruptions of Old Faithful, learners create a graphical representation for two days. Groups combine their data to determine an appropriate wait time between eruptions.
PBS
Button, Button
Youngsters count, classify, and estimate quantities using buttons after a read aloud of The Button Box by Margarette S. Reid. They discuss the difference between guessing and estimating. Based on an experiment, they predict the...


