Curated OER
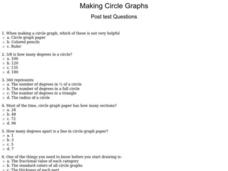
Making Circle Graphs
In this circle graphs instructional activity, students answer multiple choice questions about how to make circle graphs. Students answer 10 questions total.
Curated OER
Graphs and money
In this graphs and money worksheet, students complete word problems about different kinds of graphs and money in those graphs. Students complete 10 multiple choice problems.
Curated OER
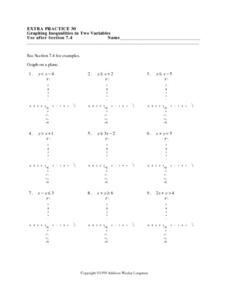
Graphing Inequalities in Two Variables: Extra Practice 30
In this math worksheet, students graph inequalities on a coordinate grid. The eight problems have a coefficient of one for the y variable. Three problems have a negative value for y. The final four problems are horizontal or vertical lines.
Curated OER
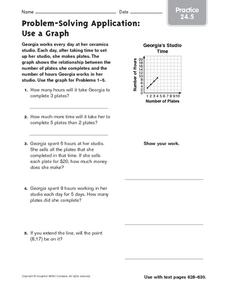
Problem-Solving Application: Use a Graph: Practice
For this graphing coordinates worksheet, students study the graph and the coordinates. Students then answer the five questions about the graph and show their work.
Curated OER
The Relationship Between Slope and Perpendicular Lines
In this perpendicular lines worksheet, students explore the relationship between perpendicular lines and slope in eight exercises and two worked examples. The solutions are provided.
Curated OER
M&M's Candies Worksheet Graph
In this graphing worksheet young scholars will record data on a bar graph. Students will take a bag of M&M's and chart the colors they find inside this bag.
Curated OER
Graphing Scatterplots
Pupils examine scatterplots and determine the equation of a line using the slope-intercept method. Students interpret graphs, draw inferences, and sketch a curve of best fit for the graph. Based upon patterns in the graphs, pupils...
Curated OER
Identifying Lines of Symmetry
Students calculate the lines of symmetry using polygons. In this geometry instructional activity, students graph, compare and estimate using collected data. They identify different attributes to the polygons based on their sides.
Curated OER
Line of Best Fit
Students explore the concept of linear regression. In this linear regression lesson, students do a Barbie bungee activity where they collect linear data. Students plot their data using a scatter plot. Students determine a line of best...
Curated OER
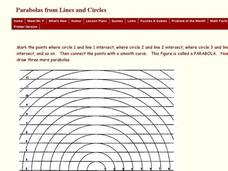
Drawing Three Parabolas from Lines and Circles
In this parabola worksheet, students draw three parabolas by connecting points. The points are formed at the intersection of circles and lines.
Curated OER
Compound Inequalities
In this algebra worksheet, 11th graders solve compound inequalities and graph their solution on a number line. There are 6 questions with an answer key.
Raytheon
Equations and Graphing Review
In this equations and graphing review instructional activity, learners write, graph and solve equations for 62 problems, including a mid-unit review, with answers included.
Raytheon
Graphing: Slope
For this slope learning exercise, students complete problems having to do with slope including adding integers, graphing, finding ordered pairs, and more. Students complete 55 problems.
Curated OER
Write Equation of a Line given the Slope
For this algebra worksheet, students solve linear equations using one and two steps. They solve systems of equations using substitution and elimination with graphing. There are links for ready made tests and quizzes.
Curated OER
Secant and Tangent Lines
Twelfth graders recognize the use of the slope of the secant line and connect it with the graph of the secant line, as the secant line approaches the tangent line. They also recognize the two forms of the slope formula used and practice...
Curated OER
Solving Systems of Equations
Learners explore the concept of solving systems of equations with two equations and two unknowns. In this solving systems of equations activity, they work through problems of solving systems by substitution, elimination, and graphing....
Curated OER
Plugging Into The Best Price
Examine data and graph solutions on a coordinate plane with this algebra lesson. Young problem-solvers identify the effect of the slope on the steepness of the line. They use the TI to graph and analyze linear equations.
Curated OER
Graph It
Elementary and middle schoolers engage in a lesson of graphing in quadrant I of the coordinate plain. They use the graph to create shapes and symbols. While using a graphing calculator, they locate the points on the coordinate plane. In...
Curated OER
Generate Measurement Data Word Problems
Using a set of simple data, learners create a line plot to organize the information. This data includes only single-digit numbers and the highest number is six. Because the answer is explained and illustrated at the bottom, project this...
Curated OER
Cloudy vs. Clear
Students analyze line plots. In this weather lesson using real NASA data, students discuss how weather affects the way the Earth is heated by comparing different line plots.
Curated OER
Graphs: All About Our Class
Students respond to survey questions, discuss results, brainstorm ways to represent survey information, and create table of class results. They find mean, range, and percentages, and create graph to display results.
Pennsylvania Department of Education
The Multiplicative Identity and Numbers Close to One
Pupils practice multiplying and dividing whole numbers by fractions. They study the multiplicative identity property that states that the product of any number and 1 is that number. They multiply whole numbers by fractions close to 1 and...
Curated OER
Generate Measurement Data Word Problems
Plot data for three word problems, each with a table of data. Learners create line plots for these, all of which have only single-digit whole numbers. The large text and few number of problems make this ideal as a whole-class warm up....
Curated OER
A Sweet Drink
Students investigate reaction rates. In this seventh or eighth grade mathematics lesson, students collect, record, and analyze data regarding how the temperature of water affects the dissolving time of a sugar cube. Studetns determin...


