Illustrative Mathematics
Sports Equipment Set
Many students like to play sports and the equipment that goes with it costs money. The resource sets up an inequality that gives a total amount needed to purchase the equipment and the initial amount of money already obtained. In order...
Curated OER
Is Portland, Oregon Experiencing Global Warming?
Students use data to determine if the climate in Portland has changed over the years. In this weather lesson students complete line graphs and study long wave radiation.
Public Schools of North Carolina
Math Stars: A Problem-Solving Newsletter Grade 1
Keep the skills of your young mathematicians up-to-date with this series of newsletter worksheets. Offering a wide array of basic arithmetic, geometry, and problem solving exercises, this resource is a great way to develop the...
CK-12 Foundation
Inverse Functions: Definition of Inverse Functions
Is the inverse of a function also a function? Pupils manipulate the graph of a function to view its inverse to answer this question. Using a horizontal and vertical line, class members determine whether the initial function is...
Illustrative Mathematics
Half of a Recipe
Kids love to cook! What is a better place to learn mixed numbers than with a recipe? It is up to learners to decide how they want to divide this recipe in half. They may choose to model the mixed number and then divide the model by two....
Curated OER
Activity: An Experiment with Dice
Roll the dice with this activity and teach young mathematicians about probability. Record outcomes for rolling two number cubes in order to determine what is most likely to happen. Graph the data and investigate patterns in the results,...
National Council of Teachers of Mathematics
Geogebra: Residuals and Linear Regression
If the line fits, use it. Using a Geogebra interactive, pupils plot points and try to find the best fit line. They assess the linear fit by analyzing residuals. A radio button allows participants to show the regression line and the...
University of California
Seasons Lab Book
Unlock the mystery behind seasonal change with a collection of worksheets and activities. Whether they are drawing pictures of Earth's orbit around the sun or graphing the temperature and daylight hours of different locations...
Math Mammoth
Grade 1 Worktext
Use graphing, counting, and number lines to help first graders learn about addition and subtraction. An array of worksheets and activities are an excellent resource for your math lesson, whether you are focusing on counting skills...
Houghton Mifflin Harcourt
Unit 1 Math Vocabulary Cards (Grade 1)
Reinforce mathematical vocabulary with the use of flash cards. Each card showcases a boldly typed word as well as a labeled picture representation of the word. Terms include addition, subtraction, greater than, less than, and more!
CK-12 Foundation
Continuity of a Function: Continuity
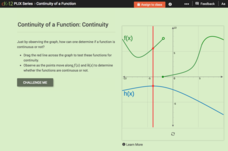
Does the point continually move along the graph? Pupils drag a line across two functions to determine whether they are continuous or not. They answer questions about the properties of continuous and discontinuous functions. Using their...
Radford University
How to Calculate and Analyze the Equation for a Parabolic Path
Working in groups, pupils plot three points on the coordinate plane representing three different parabolic paths. Using a calculator, they determine the quadratic regression equation for their models. Each team then figures out the...
Radford University
Tuition Cost Activity
Can I afford to go to college? Small groups design a method to research college tuition for several years and make a prediction of costs in 2025. Classmates plot the the data on a scatter plot and graph the line of best fit to make their...
Science Matters
Spaghetti Fault Model
Does increasing the pressure between two moving plates provide a stabilizing force or create more destruction? The hands-on instructional activity encourages exploration of strike-split fault models. The sixth instructional activity...
Curated OER
Graphing Linear Equations
In this graphing worksheet, students graph ten linear equations on each of the graphs provided. They first plug in some values to the given equation using a T-chart. This will give them their coordinates to use on the graph and form...
Curated OER
Quiz 8: Equation of a Line
In this equation of a line learning exercise, students find the equation of a line perpendicular to a graph and determine the surface area of a cube that is changing. This one-page learning exercise contains three problems.
Curated OER
Three Sets of Mental Math Problems covering Coordinates and Integer Values
In this mental math worksheet, students solve sixteen problems given in three sets. The problems are to be done without a calculator and they cover coordinates and integer values. The solutions are provided.
Curated OER
Line Plots
In this line plot worksheet, students create a line plot of given data. They identify the range, clusters, gaps, and outliers. This one-page worksheet contains 8 multi-step problems.
Math Mammoth
Parallel and Perpendicular Lines
In this parallel and perpendicular line instructional activity, students find equations of a line, then determine an equation of a line that is parallel or perpendicular to the original one. They graph problems and plot points. There are...
Curated OER
Graphing Linear Equations Using Data Tables
Young scholars review the Cartesian plane and the process of plotting points. In groups, students create tables, identify the slope and y-intercept, and graph the equation. Afterward, young scholars perform the same process, only,...
Curated OER
Linear Inequalities in Two Variables
Use this worksheet as a warm up, a refresher exercise, or a practice after a more detailed lesson on graphing linear inequalities in two variables. Start with boundaries that are horizontal or vertical, then move into graphs with...
Curated OER
Functions and Their Graphs
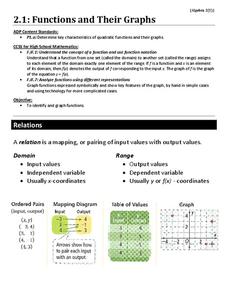
Use a worksheet to go over the basic concepts of relations and functions. Included are clear definitions and examples of relations, domain and range, and functions and the vertical line test. However, the problems are pretty...
Curated OER
Geometry: Parallel and Perpendicular Lines
This basic handout would be good for skills practice or a review of parallel and perpendicular lines. Review the definitions, then practice writing equations of lines that pass through a specific point and are either parallel or...
Curated OER
Study Guide: Rational Numbers
For this rational numbers worksheet, students solve and complete 8 different problems that include applying the comparison property and density property for rational numbers. First, they replace each blank with the correct symbol to make...


