Lake Zurich Community Unit
Inequality Word Problems
This inequality word problems activity is ideal to assess your learners' understanding of inequality and linear concepts around solving and writing equations and inequalities. Equations, graphs and real-life scenarios are used to assure...
Inside Mathematics
Archery
Put the better archer in a box. The performance task has pupils compare the performance of two archers using box-and-whisker plots. The resource includes sample responses that are useful in comparing individuals' work to others.
Virginia Department of Education
Box-and-Whisker Plots
The teacher demonstrates how to use a graphing calculator to create box-and-whisker plots and identify critical points. Small groups then create their own plots and analyze them and finish by comparing different sets of data using box...
Curated OER
MAP Practice
In this geometry activity, students create circle, line and bar graphs using different comparisons of events. There are 24 questions with an answer key.
Texas Instruments
Function Notation - Texas Instruments
Using a TI-Nspire calculator, learners will work to better understand function notation and input/output functions. They write equations with a function symbols, identify what makes an equation a function, and graph lines in order to...
EngageNY
Conversion Between Celsius and Fahrenheit
Develop a formula based upon numerical computations. The 31st part of a 33-part unit has the class determine the formula to convert a temperature in Celsius to a temperature in Fahrenheit. They do this by making comparisons between the...
US Department of Commerce
Learning About College Degrees and Lifetime Earnings
It's never too early to start thinking about college majors. Using census data, scholars research the lifetime earnings for two selected careers. They then write and solve word problems to compare the amounts. To add a visual component,...
Centers for Ocean Sciences
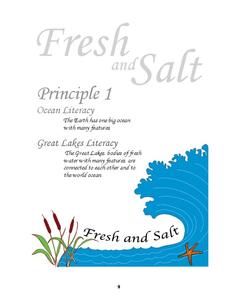
Ocean and Great Lakes Literacy: Principle 1
Is your current lesson plan for salt and freshwater literacy leaving you high and dry? If so, dive into part one of a seven-part series that explores the physical features of Earth's salt and freshwater sources. Junior hydrologists...
Living Rainforest
Finding the Rainforests
From Brazil to Indonesia, young scientists investigate the geography and climate of the world's tropical rain forests with this collection of worksheets.
Curated OER
Probability: The Study of Chance
Students conduct an experiment, determine if a game is fair, and collect data. They interpret data, then display line graph. They conduct analysis of game for probability.
Curated OER
Electric Field Mapping / Equipotential Lines
Students determine the equipotential lines surrounding a charged object. In this physics lesson, students draw lines to identify areas. They relate the spacing of the field lines to the strength of the charge.
Curated OER
Recognizing Bias in Graphs
In this bias in graphs worksheet, students examine graphs and explain the data. They determine why the graph is or is not biased. This four-page worksheet contains approximately 6 problems. Explanations and examples are provided.
Curated OER
Measuring & Graphing Motion
Fifth graders study how to measure distance. In this graphing motion lesson students complete a lab activity that shows them on the computer how to make graphs.
Curated OER
The Shortest Line Mystery
Students calculate the shortest distance of various scenarios. For this algebra lesson, students interpret graphs of optimization problems. They use a graphing calculator to assist them in graphing and making predictions.
Curated OER
Proportionality in Tables, Graphs, and Equations
Students create different methods to analyze their data. In this algebra lesson, students differentiate between proportion and non-proportional graph. They use the TI-Navigator to create the graphs and move them around to make their...
Curated OER
Slopes and Lines
Young scholars identify the slopes of a line. For this algebra lesson, students calculate the slope and intercept of a line. They graph their lines using a TI calculator.
Curated OER
Jump and Graph
Third graders practice measuring skills by jumping and measuring the lengths with yardsticks. After measuring five jumps each, they draw bar graphs representing their jumps.
Curated OER
Whole Numbers
A game is a great way to learn. Study what makes an integers, their traits, and characteristics. This lesson includes 3 separate activities intended to promote an understanding of integers, whole numbers, and opposites. The class is...
Curated OER
Finding the Slope of a Line from a Graph
In this slope worksheet, students determine the slopes of sixteen different graphed lines. Solutions are provided on pages three and four of this worksheet.
Curated OER
Point Graphs
Students experiment with point graphs. In this math lesson, students are divided into groups and perform an experiment to see how high a ball bounces, recording their results on a point graph. Students then answer provided questions.
Curated OER
Graphing a Line Parallel to an Axis
In this Algebra I/Algebra II learning exercise, students graph lines parallel to an axis. The one page learning exercise contains one multiple choice question with the answer.
Curated OER
Coordinate Graphs
Students use coordinate graphs in order to identify objects and their locations. They are shown how to plot the x and y coordinates and then are given values to be plotted during guided and independent practice. Students are assessed on...
Curated OER
Using Graphs
For this using graphs worksheet, 9th graders solve and complete 6 different types of problems. First, they determine how the transformation shown moves the graph. Then, students find the interval that is defined given the coordinates....
Curated OER
Slope of a Line
Students identify the slope of a line. In this algebra activity, students discover the process of how to find the slope of a line and classify the slope as positive, negative, zero or undefined. They find the slope of a line given two...


