Teach Engineering
The Challenge Question
A research position becomes a modeling job. The introductory activity in a series of nine presents the challenge of analyzing a set of bivariate data. The class brainstorms what the data may represent. Pupils must decide what is needed...
Curated OER
Linear Regression and Correlation
Learners explore scatter plots. In this linear regression lesson, groups of pupils graph scatter plots and then find the line of best fit. They identify outliers and explain the correlation. Each group summarizes and shares their...
Math Sphere
Co-Ordinates
Challenge young mathematicians' understanding of the coordinate plane with this series of skills practice worksheets. Offering 10 different exercises that involve identifying ordered pairs, graphing polygons, and rotating/reflecting...
Curated OER
Run, Gingerbread Men, Run!—Game
Run, gingerbread men! During the board game, four gingerbread men race to discover which one finishes first. Scholars take note of the game's results using a tally chart and bar graph for all to observe the frequency of the winning...
EngageNY
End-of-Module Assessment Task: Grade 8 Module 4
Connect proportional linear equations and systems. The seven-question assessment is the last installment in a 33-part series. The items cover comparing proportional relationships, slope concepts, and simultaneous linear equations. To...
02 x 02 Worksheets
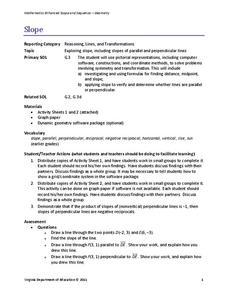
Slope
What does slope have to do with lines? Pupils work with lines and determine the slope of the lines informally and with the slope formula. Groups use their knowledge to calculate the slopes of parallel and perpendicular lines. They also...
National Security Agency
What’s Your Coordinate?
Your middle schoolers will show what they know with their bodies when they become the coordinate plane in this conceptual development unit. Starting with the characteristics of the coordinate plane, learners develop their skills by...
Bowels Physics
Graphical Analysis
Assist your class in learning graphical analysis by reviewing the slide presentation. Class members review 15 slides to further understand concepts such as velocity and acceleration. They conclude with practice problems related to the...
Charleston School District
Solving Systems by Inspection
Can you solve a system by just looking at it? The previous lessons in the series taught three methods of solving systems of equations. Now learners discover they can determine the number of solutions of a system just by looking at it....
EngageNY
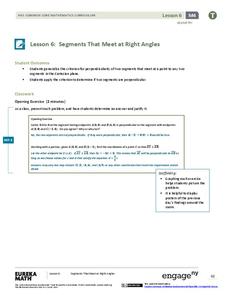
Segments That Meet at Right Angles
Can segments be considered perpendicular if they don't intersect? Learners look at nonintersecting segments on the coordinate plane and make conclusions about the lines that contain those segments. They determine if they are...
EngageNY
Analyzing Residuals (Part 2)
Learn about patterns in residual plots with an informative math activity. Two examples make connections between the appearance of a residual plot and whether a linear model is the best model apparent. The problem set and exit ticket...
EngageNY
Problem Solving and the Coordinate Plane
Class members investigate rectangles on the coordinate plane. They determine the length of line segments in the coordinate plane with the same x-coordinate or same y-coordinate and then solve geometric problems involving perimeter and...
Statistics Education Web
Text Messaging is Time Consuming! What Gives?
The more you text, the less you study. Have classes test this hypothesis or another question related to text messages. Using real data, learners use technology to create a scatter plot and calculate a regression line. They create a dot...
Kenan Fellows
Let's Move
Find a statistical reason for a fresh start. Using a hypothetical scenario, individuals research statistical data of three different cities. Their goal? Find the best statistical reason for a business to move to a new location. Their...
National Council of Teachers of Mathematics
National Debt and Wars
Take a functional approach to the national debt. Learners collect information about the national debt by decade and plot the data. They determine whether an exponential curve is a good fit for the data by comparing the percent changes...
Teach Engineering
Applications of Linear Functions
It's not so straightforward — lines can model a variety of applications. Pupils experience linear relationships within the context of science, including Hooke's and Ohm's Laws. Class members got a taste of motion and speed from the...
Balanced Assessment
Books from Andonov
To examine mathematical functions in a modeling situation pupils combine quadratic and step functions to represent a presented scenario. They both graph and write a function to represent data shown in a table.
Concord Consortium
Sine Solution
How many times can eager mathematicians catch the waves? Pupils find the solutions of three different trigonometric equations. They then determine the effect of the slope of a line that intersects a trigonometric function and the number...
August House
Why Koala Has a Stumpy Tail
Learn about the animals of Australia with a language arts lesson about an Australian folktale called, Why Koala Has a Stumpy Tail. After reading the story as a class, kids discuss events and characters from the book, retell the story to...
Charleston School District
Pre-Test Unit 4: Linear Funcitons
Let your classes show you what they know! Use this pre-test to assess the current knowledge of your learners. The assessment includes all pre-algebra concepts related to functions: writing and graphing linear relationships, comparing...
Kenan Fellows
Man vs. Beast: Approximating Derivatives using Human and Animal Movement
What does dropping a ball look like as a graph? An engaging activity asks learners to record a video of dropping a ball and uploading the video to software for analysis. They compare the position of the ball to time and calculate the...
Concord Consortium
Parameters and Clusters I
Chase the traveling solution. Pupils analyze the solutions to a system of linear equations as the parameter in one equation changes. Scholars then use graphs to illustrate their analyses.
Curated OER
Weathering Lab
Assist your middle school class with one of the most inclusive weathering and erosion labs available. Individuals use sugar cubes and alka-seltzer to demonstrate the process of physical and chemical weathering. They sketch results...
Curated OER
Less and More Scavenger Hunt
Send your scholars on a measuring scavenger hunt with this interactive worksheet! They use a graphic organizer to record their findings as they search for items which are less than, more than, or just about one inch long. For each, they...


