Curated OER
Worksheet 7 - Asymptote
In this asymptote worksheet, students compute limits, graph vertical asymptotes, and find the slope of the secant line. This one-page worksheet contains six multi-step worksheets.
Georgia Department of Education
The Basketball Star
Have learners use math to prove they are sports stars! Assess a pupil's ability to create and analyze data using a variety of graphs. The class will be motivated by the association of math and basketball data.
Curated OER
Worksheet 24
In this math worksheet, students work with three dimensional graphing. The application problems include surface ships on maneuvers determining a submarine's course, helicopter travel, and proving that four points are coplanar. Students...
Curated OER
Worksheet 8 - Limit of Slopes
In this limit of slopes worksheet, students compute the limit of slopes, find the slope of the secant line, and determine the slope of the tangent line. This one-page worksheet contains five multi-step problems.
Curated OER
Virtual Field Trip
Are we there yet? Young trip planners learn about their state and plan a trip. They will select sites to see in three cities in their state, and record associated costs in a spreadsheet. While this was originally designed as a...
Curated OER
Exploring Circles
Students explore circles using a graphing calculator. In this circles instructional activity, students write the equation of a circle with a given center and radius length. Students find the most appropriate model for each combination of...
Curated OER
CCC: Credible sources, Creative Commons Images, and Citing Your Sources
As part of a unit devoted to the study of autobiographies, this one-day library session focuses on developing research skills. Class members locate and properly cite a sketch of a Creative Commons image, as well as record the call...
Curated OER
Graphing Exercise of Ideal Gas Data
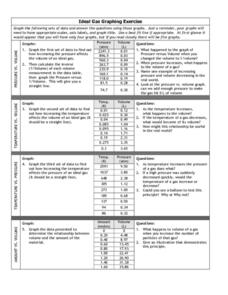
In this graphing of Ideal Gas Data worksheet, students use the given data to draw 4 graphs of the given data. They are given the pressure and volume to draw and interpret the graphs.
Curated OER
Data Analysis
For this data analysis worksheet, students solve and complete 4 different types of problems. First, they reduce the data provided to find the means, and graph the means in a line graph. Then, students graph the data from each mixture...
Curated OER
Graphing Aquatic Insects
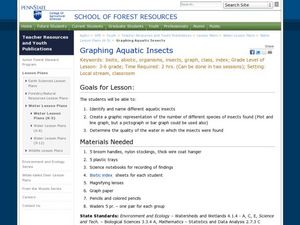
Students identify aquatic insects. In this organism lesson, students locate aquatic insects near a local waterway and collect them. Students graph the amount of insects that they collected.
Curated OER
Coordinate Graphing
Students practice basic coordinate graphing and plotting points on the coordinate axis. In this geometry lesson plan, students are introduced to ordered pairs, and the x and y axis.
Curated OER
You mean college costs that much?
Seventh graders collect, organize, and analyze data as they research colleges on the Internet. They graph their collected data on a line graph and use a spreadsheet on Microsoft Excel in order to organize the data.
Curated OER
Conduction, Convection, Radiation, Oh My!
Students draw a line graph, and use graphing as a tool to discover more about conduction, convection and radiation. They should design their own experiment using heat sensitive paper to show they explain these 3 processes.
Curated OER
Interpreting Data and Statistics
Students define terms and analyze data. In this statistics lesson, students plot their data using bar and line graphs. They analyze their data after they graph it and apply the results to the Great Depression.
Curated OER
It's Your Life
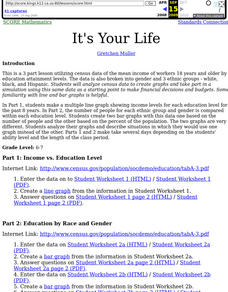
Students make a multiple line graph showing income levels for each education level for the past 8 years and the number of people for each ethnic group and gender is compared within each education level.
Curated OER
Data Analysis, Probability, and Discrete Mathematics
Fourth graders analyze the data in a bar graph, pictograph, line graph, and a chart/table and draw conclusions based on the data. They discuss each type of graph, write questions for each graph, and analyze the data as a class.
Curated OER
Mapping the Ocean Floor
Students construct and interpret a line graph of ocean floor depth and a bar graph comparing the height/depth of several well-known natural and man-made objects and places. In addition, they calculate the depth of two points using sonar...
Curated OER
Cities
Learners examine U.S. Census figures. In this urban centers lesson plan, students compare city populations across the span of 50 years. Learners create line graphs based on the data.
Curated OER
Temperature and Tracking Weather
Fourth graders discuss, describe and track weather by utilizing a variety of measurable quantities as temperature, wind speed, wind direction, cloud conditions and precipitation. They assess, through experiments and practicing, how to...
Curated OER
Compound Inequalities
Students solve linear equations with compound inequalities. In this algebra lesson, students solve inequalities and graph their solution on a number line. They define "and" and "or" when it comes to graphing.
Curated OER
Double Data
In this data learning exercise, learners answer 4 questions about a double line graph. For example, "How can you use the graph to figure out when each alligator grew the most?"
Curated OER
Systems of Equations
In this Algebra 2 learning exercise, students solve systems of equations and inequalities then graph the solutions on a number line. There are 11 problems to solve.
Curated OER
Weather Data Analysis
In this weather activity, students read a data table comparing the temperature and weather conditions at three different locations. Students use this data to complete 8 fill in the blank, 1 short answer question, and one graph.
Curated OER
The Effects of Light Intensity and Wavelength on the Rate of Photosynthesis
Students use an on line website to simulate the effects of light intensity and wavelength on photosynthesis. In this photosynthesis lesson plan, students determine how wavelength of light and intensity of light affect the rate at which...


