Curated OER
Inequalitities Mixed Review
Learners solve inequalities and graph it on a number line. For this algebra lesson, students rewrite word problems into algebraic equations and graph it using compound inequalities.
Curated OER
Atomic Fractions-III
In this atomic fractions worksheet, learners read about electrons and energy levels. Students find all the possible energies that an electron could lose as it jumped from one energy level to another based on a given diagram. They...
Curated OER
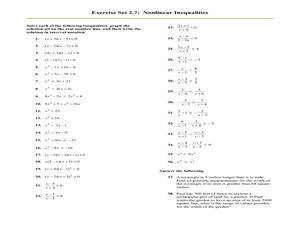
Nonlinear Inequalities
In this Algebra II worksheet, 11th graders solve nonlinear inequalities, graph the solution set on the number line, and write the solution in interval notation. The one page worksheet contains thirty-eight problems. Answers...
Curated OER
Creek Detectives WISE On-line Research Community
Students investigate ways people cause harm to the environment. In this environmental lesson, students explore a case study on the Internet. Students explore all of the online activities and collect data for a presentation.
Curated OER
Adding Signed Numbers
In this algebra worksheet, students add and subtract using negative integers that will make the equation a true statement. They graph their answers on a number line. There are 30 questions.
Curated OER
Finding and Estimating Square Roots
In this algebra activity, students solve the square root through estimation and through the calculator. They graph their solutions on a number line. There are 4 questions with an answer key.
Curated OER
Linear Equations
In this algebra worksheet, students solve and graph linear equations. They differentiate between parallel and perpendicular lines. There are 35 questions about graphing.
Curated OER
Graphing Linear Functions - Review
Students graph linear functions. They plot three points, create a line, and discuss methods to find the slope of line. In groups, students solve problems, graph their lines and find the slope of a line using various methods. Upon...
Curated OER
Show Me!
Students analyze and interpret graphs. For this graphing lesson, students view a video and construct their own graphs (line, circle, bar) from given sets of data.
Curated OER
Skittles, Taste the Rainbow
Fifth graders learn and then demonstrate their knowledge of a bar and a circle graph using the classroom data. Students are given a pack of skittles candy. Students create a bar and circle graph indicating the results of the contents of...
Curated OER
Graphing Favorite Holidays
Pupils create spreadsheets and bar graphs based on results of survey of favorite holidays.
Curated OER
Graphing in Science
Students manipulate and interpret data. They are given a dataset from a described experiment and interpret the data. A "How to Sheet for graphing" is included in lesson plan.
Curated OER
Data Collection - Primary Poster
Students explore the concept of collecting, analyzing, and graphing data. In this collecting, analyzing, and graphing data lesson plan, students create a survey about a topic of interest. Students poll their classmates, analyze, and...
Curated OER
Race Track (Culminating Activity)
Students graph and solve linear equations. In this algebra lesson, students use the slope and y-intercept to graph lines. They relate lines to the real world using different applications.
Curated OER
Dynamite Data
Second graders rotate through a variety of stations designed to offer practice in manipulating data. They sort, tally and count items and then create bar graphs, tables, and pie graphs to record their findings.
Curated OER
Robot Rounding!
Students collect data on a robot and relate the behavior to prove there is an infinite minute set of numbers. In this algebra lesson, students verify that there is always a number between two numbers. They analyze and make inference...
Curated OER
SkittleGraphs
Second graders discover how to make a bar graph. Each student receives a bag of Skittles candy. They make a bar graph which documents the colors found in the bag. At the end of the lesson, the Skittles are eaten. Fun!
Curated OER
Bar and Histograms (What Would You Use: Part 1)
Students practice creating bar graphs using a given set of data. Using the same data, they create a group frequency chart and histograms. They must decide the best graph for the given set of data. They share their graphs with the...
Curated OER
Mean, Median, Mode, and Range: Reteach
In this line plots worksheet, students review how to make a line plot to show data and review the steps to find mean, median, mode, and range. Students then make a line plot for the data in exercise 1 and use it to answer the remaining...
Curated OER
Exploring Quadratic Graphs
Students solve quadratic equations using graphs. In this algebra lesson, students factor quadratic equations and graph their answer. They discuss the shape of their graph based on the function.
Curated OER
Temperature
Students explore the concept of temperature. In this temperature lesson plan, students read thermometers in degrees Celsius. Students discuss the temperature of the seasons and what clothing they might wear given a certain temperature....
Curated OER
Graphing Linear Inequalities
In this algebra activity, students graph inequality linear graphs and shade using a test point. There are 14 problems with an answer key.
Virginia Department of Education
Transformationally Speaking
Young mathematicians explore transformations of graphs by graphing sets of functions on the same pair of axes. They use their graphs to determine the effect that the values of a and b in y = ax + b have on the graph of y = x.
Curated OER
Scattered About
Students are introduced to the concept of scatter plots after reviewing the various types of graphs. In groups, they analyze the type of information one can receive from a scatter plot and identify the relationship between the x and y...


