Kelly's Kindergarten
March Daily Activities
There's a pot of gold at the end of the school year! Use a month's worth of reading, writing, and counting activities to keep kids learning through the month of March.
Noyce Foundation
Ducklings
The class gets their mean and median all in a row with an assessment task that uses a population of ducklings to work with data displays and measures of central tendency. Pupils create a frequency chart and calculate the mean and median....
Curriculum Corner
“I Can” Common Core! 1st Grade Math
Any first grader can master the Common Core math standards with this checklist! With each standard rewritten as an affirmative I can statement, children are provide with clear goals to work toward throughout the school year.
Display an...
Curated OER
Lesson #46: Bar Graphs and Line Graphs
In this bar graphs and line graphs worksheet, students interpret bar graphs, line graphs, and box-and-whisker plots. They find the measures of central tendency. This three-page worksheet contains notes, vocabulary, and approximately 10...
Curated OER
Mean, Median, and Mode
Young scholars calculate measures of central tendency. in this mean, median, and mode lesson, students calculate the measures of central tendency. They organize data, examine and explain the statistics.
Curated OER
Permafrost: Permanently Frozen Ground
Students explore permafrost. In this 3 states of matter lesson, students identify characteristics of solids and liquids. Students observe water and soil melting and freezing at various temperatures. Students make predictions about a...
Curated OER
Farming: Raising Winter Wheat (Lesson 3)
Students identify foods that are made from wheat. They use a line graph to explain measurement. They identify foods from the food groups and explain how temperature, prefcipitation and natural resources affect the growth of wheat.
Curated OER
Use of Numbers
In this number usage worksheet, students tell how each number is being used in the given examples. Students write position, count, measure, and label for the number uses. Students also complete two test prep questions about uses of numbers.
Curated OER
Measuring in Inches
Third graders will sing 2 songs that are written and played by the teacher and relate to the task of measuring.They recognize and pick up a 1-foot standard ruler and be able to identify the marks on the ruler, including inch and parts of...
Curated OER
Writing in Scientific Notation
Students discover number sense by completing a math worksheet. In this scientific notation lesson, students identify the purpose for writing in scientific notation and practice writing large numbers in scientific notation. Students...
Curated OER
Target Earth
Space scientists use water displacement to determine the mass of a cubic centimeter mini meteorite, and then use it as a small-scale representative of an asteroid. They figure out the orbital velocity of an asteroid. Then they use a...
Curated OER
Schoolyard Bird Project
Students observe and count bird sightings around their schoolyard throughout the school year.
Curated OER
Imagers: The Adventure of Echo the Bat Number to Pictures: How Satellite Images are Created
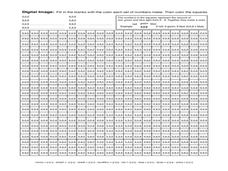
Young scholars examine the three primary colors of light and design a numerical code to represent those colors. They tell how satellites use numbers to create satellite images after completing a number of experimental activities.
Curated OER
Calendar Time
Use circle time to work on counting. Kindergarteners practice the months of the year, say the full date, chart the day's temperature, count to 100, and sing the alphabet song. This kind of daily routine cultivates deep roots for...
Curated OER
"Caterpillars to Butterflies"
Students participate in a variety of activities about how caterpillers become butterflies.
Curated OER
Measuring Math Vocabulary
Students go over math vocabulary words and show examples of the terms on the board. For this math vocabulary lesson plan, students go over many words and are given a worksheet with words and definitions.
West Contra Costa Unified School District
The Power of Ten: Building a Magnitude Model
Add visual representation to teaching place value with a magnitude model. Using adding machine tape, pupils build a linear place value strip from 1 to 100.
Inside Mathematics
Snakes
Get a line on the snakes. The assessment task requires the class to determine the species of unknown snakes based upon collected data. Individuals analyze two scatter plots and determine the most likely species for five additional data...
Los Angeles County Office of Education
Assessment for the California Mathematics Standards Grade 7
In need of an all-inclusive seventh grade math resource? Packed full of the topics necessary for Pre-Algebra the packet includes practice problems with different difficulty levels. It works great for any supplemental use needed in the...
Curated OER
Average
In this number averages worksheet, students review how to find the average of a given set of numbers. Students then complete three word problems by averaging numbers.
Curated OER
Earthquake Power
In this earthquakes instructional activity, students learn about the measurements of earthquakes on the Richter scale. They answer six questions about the magnitudes and sizes of earthquakes using two tables of data about earthquakes and...
Curated OER
Hoe Long Does it Take to Get to a Star
Learners calculate the distance in light years. In this geometry lesson, students solve problems involving distance, using the distance formula. They rewrite big numbers using scientific notations and apply their knowledge of everyday...
Curated OER
Analyzing Intertidal and Deep Sea Vent Communities
Students study how scientists measure diversity. In this diversity lesson plan students look at marine communities and look at data to calculate diversity in 3 different ways.
Curated OER
Scientific Sampling
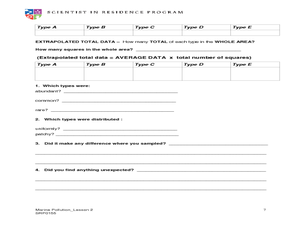
Students take a sample of fish and try to determine how many fish are in the sea. In this scientific sampling lesson, students explore the way scientists measure large areas of samples. Students record the distribution in a quadrant.


