Curated OER
California Biodiversity
Students examine several maps of California exhibiting features such as precipitation, topography, and vegetation. They look for patterns that might be the source of or influence biodiversity in different regions. They pay particular...
Curated OER
What Was for Dinner?
Young scholars examine energy obtaining strategies that are used by organisms in deep reef communities. In this ocean lesson students complete an isotope activity.
Curated OER
Weather Olympics
Students consider the effects of topography on climate patterns. In this earth science lesson, students research weather patterns and make inferences of how the land forms may create different climates. Students compare Celsius...
Curated OER
Sea Secrets
Students study the following: For centuries, people have been challenged by the mysteries that lie beneath the blue depths of our ocean planet. Very little was known about the ocean until late in the nineteenth century, although nearly...
Curated OER
Sea Floor Spreading II
Students import ocean bathymetry data from text files. They then graph these observations along with model predictions to assess the model's ability to simulate observed topographic features of the North Atlantic. Students use Excel to...
Curated OER
Currents: Bad for Divers; Good for Corals
Students describe, compare, and contrast major forces that drive ocean currents. They discuss the general effects of topography on current velocity. They discuss how velocity affects the ability
Curated OER
Ring Detectives
Students describe the overall flow of the Gulf Stream, and explain how it affects biological communities in the North Atlantic Ocean.Students describe Gulf Stream rings, and explain how they are formed.Students be abl
Curated OER
Stranded along the Coast
Students plot stranding sites onto a map using latitude and longitude as well as compass directions with respect to coastal features. They identify several species of marine animals that might become stranded; distinguish their...
Curated OER
NOAA Research Project
Young scholars research any topic relating to the National Oceanic and Atmospheric Administration (NOAA) research cruise that Mrs. Richards be participating in.
Curated OER
Where are the Watersheds in San Francisco?
Students create a mental map of San Francisco. They compare it with actual topographical maps of the city. Then they label various locations on the San Francisco Hillshade map and locate watershed boundaries.
Curated OER
A Model of the Sea-floor
Students create a paper model to illustrate sea-floor spreading.
Curated OER
Faking It
Middle school earth scientists describe the behavior of the Coriolis force. They compare and contrast conditions under which the Coriolis force has a significant impact with conditions under which it has very little. They model the...
Oregon State
World Map of Plate Boundaries
Young geologists piece together the puzzle of plate tectonics in an earth science lesson. Given a physical map of the world, they search for land formations that indicate the location of different types of plate boundaries.
Curated OER
Put the Title of the Lesson Here
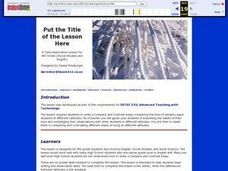
Eighth graders write a Compare and Contrast essay comparing the lives of similarly aged students at different Latitudes. They share their essays with epals, via e-mail. They may include digital photographs in their correspondence as well.
California Polytechnic State University
Australian Geography Unit
At the heart of this resource is a beautifully detailed PowerPoint presentation (provided in PDF form) on the overall physical geography of Australia, basic facts about the country, Aboriginal history, and Australia culture and lifestyle.
NOAA
Tides
Low tides, high tides, spring tides, neap tides, diurnal tides, semidiurnal tides, mixed tides ... just how many types of tides are there? The 10th installment of a 23-part NOAA Enrichment in Marine sciences and Oceanography (NEMO)...
Polar Trec
Global Snow Cover Changes
Snow is actually translucent, reflecting light off its surface which creates its white appearance. Pairs or individuals access the given website and answer questions about snow cover. They analyze graphs and charts, examine data, and...
Curated OER
River Run Through It
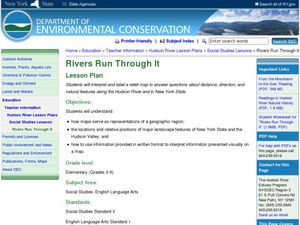
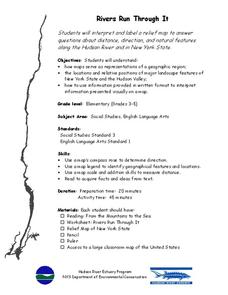
With vocabulary lists, worksheets, and more, this lesson sets learners on an exploration of the Hudson River area. They read an essay about the area, analyze a relief map of New York State, and complete a worksheet.
University of Southern California
Wave Erosion Lab
Using a stream table, erosion enthusiasts examine how the density of sediment and how the slope of land contribute to the amount moved by waves. You will not be able to use this entire resource as is; there are teachers' names and...
Curated OER
Rivers Run Through It
Using a relief map of New York State, learners answer questions about the distance between different cities, identify bodies of water, and more. First, they discuss vocabulary related to the Hudson River area. Then, they complete a...
Curated OER
In Search of the Giant Squid
Students examine the giant squid and its habitat. In this giant squid lesson, students discover the size, behavior, and natural habitat of the giant squid. Activities range from scientific information to myths and folklore. Students...
Curated OER
At the Edge of the Continent
Students study how to interpret a bathymetric map. They study the main features of the continental margin. They plot and graph bathymetric data. They think about and discuss the bathymetry of the edge of the cont
Curated OER
Observing Lava Flows
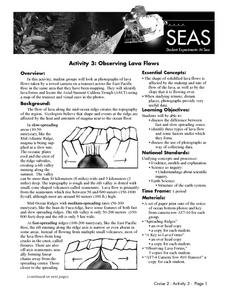
Learners examine the difference between fast and slow spreading lava flows. They identify various types of lava flow and determine the factors that cause them to form. Viewing photographs of lava flows, students working in groups,...
Curated OER
Water: Where in the Watershed?
Learners become connected to their watershed by exploring a local water body and mapping its features. They focus on how the local watershed fits into the larger scheme of the watershed.


