Curated OER
Mapping the Canyon
Students compare and contrast topographic maps and bathymetric maps. They investigate how bathymetric maps are made and how to interpret one.
Curated OER
What Causes the Seasons?
Learners conduct experiment to examine how tilt of globe influences warming caused by lighted bulb. They monitor simulated warming of their city by sun in winter and in summer by using light bulb, interpret results, and submit lab report.
Curated OER
Ecosystems Connect
Young scholars investigate ecosystems near their school and across the world. They examine both living (biotic) and non-living (abiotic) elements of each. They recognize ecosystems from various continents around the globe. The use of...
Curated OER
Geography Awareness Week: Practice Mapping Skills
You won't get lost, after learning map skills during Geography Awareness Week.
Curated OER
Working with Contour Maps
In this contour maps worksheet, high schoolers use contour maps to determine the slope and steepness of different land masses. This worksheet has 16 fill in the blank questions.
Curated OER
It's Gettin' Hot In Here, So Transfer Energy
Young scholars study the means by which energy is transferred from the sun through the Earth's atmosphere. They examine radiation, conduction, and convection. They complete a lab to determine how the different transfers affect the...
Curated OER
All Hands on Deck: A Harbor Education Program
Students build a model of an estuary. In this wetland lesson, students build a model estuary with a paint tray and modeling clay. They use the model to illustrate the impact of non-point pollution on the watershed.
Michigan Sea Grant
Exploring Watersheds
Collaboratively, students partake in a hands-on activity in which they build models of a watershed. Each group member draws an elevation map—a bird's eye view—of their model and predicts how water will flow from the high to low points....
Curated OER
General Climate Concepts
Students are taught how to use the climatology section of the Digital Atlas of Idaho. They discuss the major factors influencing climate. Students gather and synthesize new information to enrich their comprehension of climate factors.
Curated OER
Geographic Effects on Precipitation, Water Vapor and Temperature
Students investigate the factors affecting climate using Live Access Server. For this geography lesson, students graph atmospheric data using Excel spreadsheet. They compare and contrast temperature, precipitation and water vapor of two...
Curated OER
Mapping Seamounts in the Gulf of Alaska
Students describe major topographic features on the Patton Seamount, and interpret two-dimensional topographic data. They create three-dimensional models of landforms from two-dimensional topographic data.
Curated OER
Hudson Canyon Expedition Let's Bet on Sediments!
Students investigate and analyze the patterns of sedimentation in the Hudson Canyon students observe how heavier particles sink faster than finer particles. They study that submarine landslides (trench slope failure) are
Curated OER
Appreciating The World By Learning About Landforms
Children can learn about the Earth's landforms and develop a greater appreciation of our world.
Smithsonian Institution
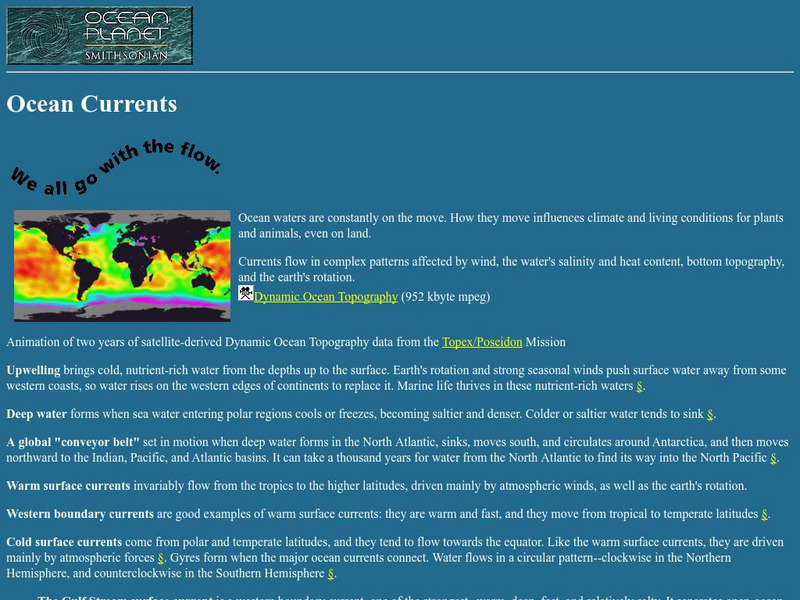
National Museum of Natural History: Ocean Planet: Ocean Currents
The Ocean Planet exhibit at the Smithsonian explains the general features of ocean circulation. A general look at upwelling, deep water, and currents are combined for an overall view.
NASA
Nasa: Dynamic Ocean Topography With Current Arrows
Color-coded image of ocean currents depicts directional flow and speed of the currents across the globe.
NASA
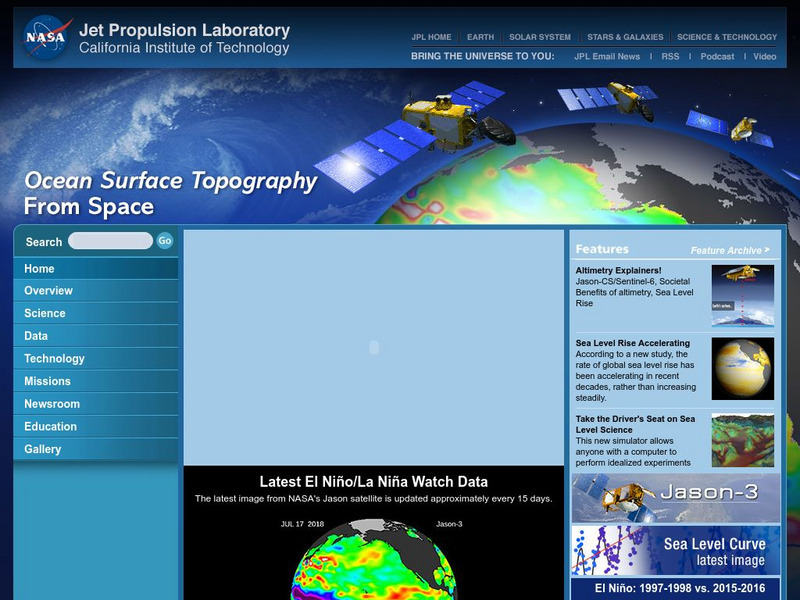
Nasa: Ocean Surface Topography From Space
Find out about ocean surface topography and the many contributing factors that continually shape the oceans and its sea levels.
Texas A&M University
Ocean World: Bringing the Ocean to the Classroom
Online resource for students and teachers to see information on icebergs, fisheries, coral reefs, waves, currents and more. Provides teachers with learning activities. Has its own ask-an-expert site (Ask Dr. Bob), and provides real-time...
Science Education Resource Center at Carleton College
Serc: Fathoms, Ship Logs, and the Atlantic Ocean
Students use data from ship logs to graph a profile of the Atlantic Ocean. They will rely on prior knowledge of seafloor topography, instructions on how to read a bathymetric map, and observe a demonstration where the depth of the ocean...
Texas A&M University
Ocean World: Satellite Oceanography
What does a satellite in space have to do with the oceans? Discover the answer to this question as well as uncover some interesting facts about satellites at this site.
NOAA
Noaa: Ngdc: Images, Visualizing Data
The National Geophysical Data Center has transformed extensive ocean research into colorful video, 3D maps, charts posters and more! This site starts off with a film clip of a dive into the Marianas trench and then lead you to other...
NASA
Nasa: Oceanography
Join NASA in its study of oceanography and learn about the Earth system, the physical ocean, and life in the ocean. Try out the Giovanni: Earth Data Visualization Tool and access satellite-derived data to enhance the learning experience.
Vision Learning
Visionlearning: Earth Science: Plate Tectonics I: Geologic Revolution
Instructional module focusing on the development of plate tectonic theory. Discussion includes the evidence of Pangaea, and the processes of seafloor topography and seafloor spreading. Site also includes an interactive practice quiz and...
Georgia Department of Education
Ga Virtual Learning: Weather and Climate
In this amazingly comprehensive interactive tutorial you will learn how factors such as ocean currents, topography, and air currents affect weather patterns. You will also learn the similarities and differences between weather and climate.
Latimer Clarke Corporation
Altapedia Online: World Map Resources
Features downloadable World Political and Physical Maps that include country names, country borders, ocean features, island names, and lat/long graticules. Clicking on any part of the map enlarges it.


